
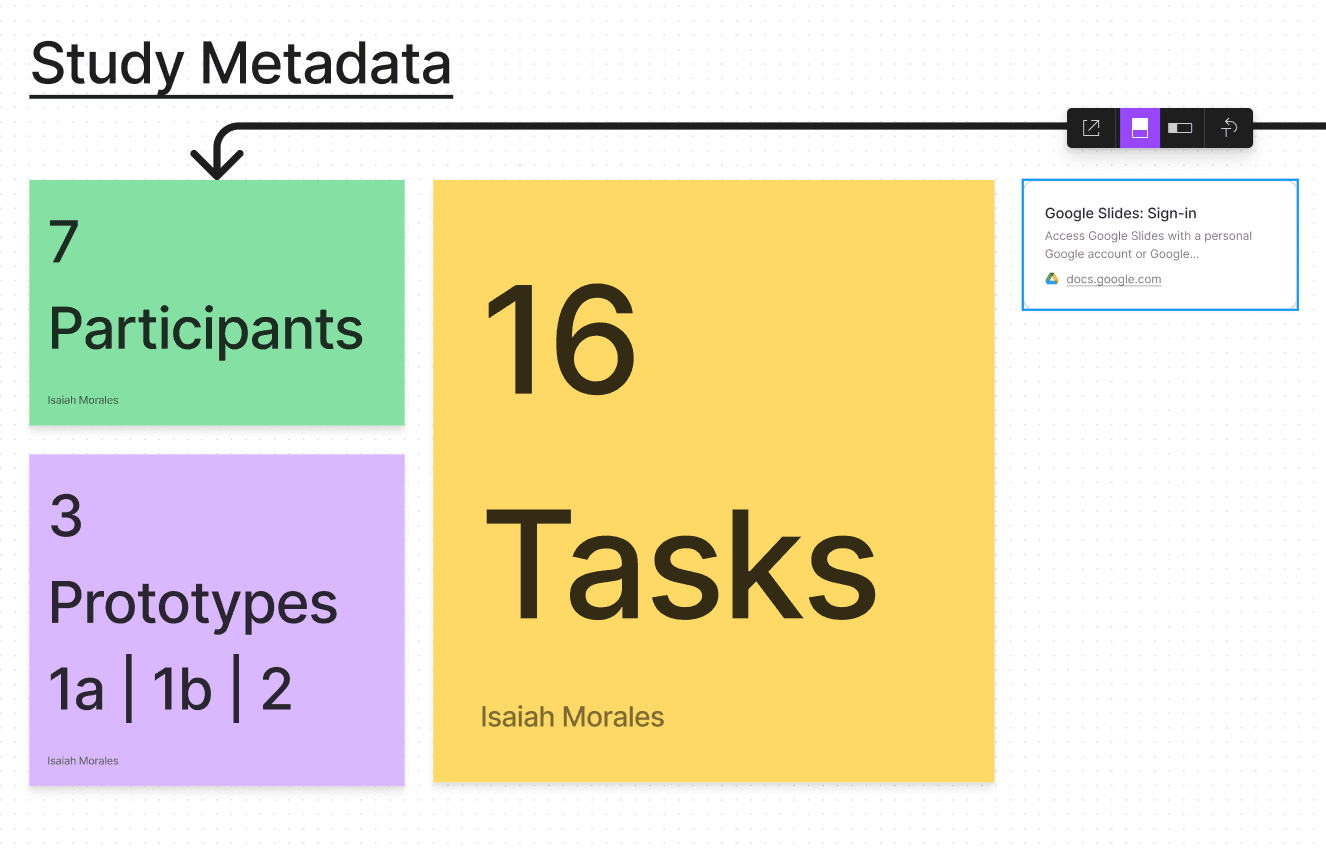
Primary Research
Universal Parks and Resorts
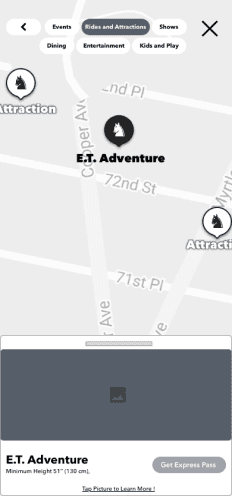
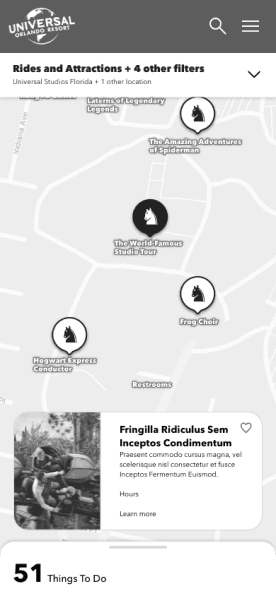
Interactive Park Maps
My Role:
Lead UX/UI Designer | UX Researcher | Product Designer | Prototyper
Product Description:
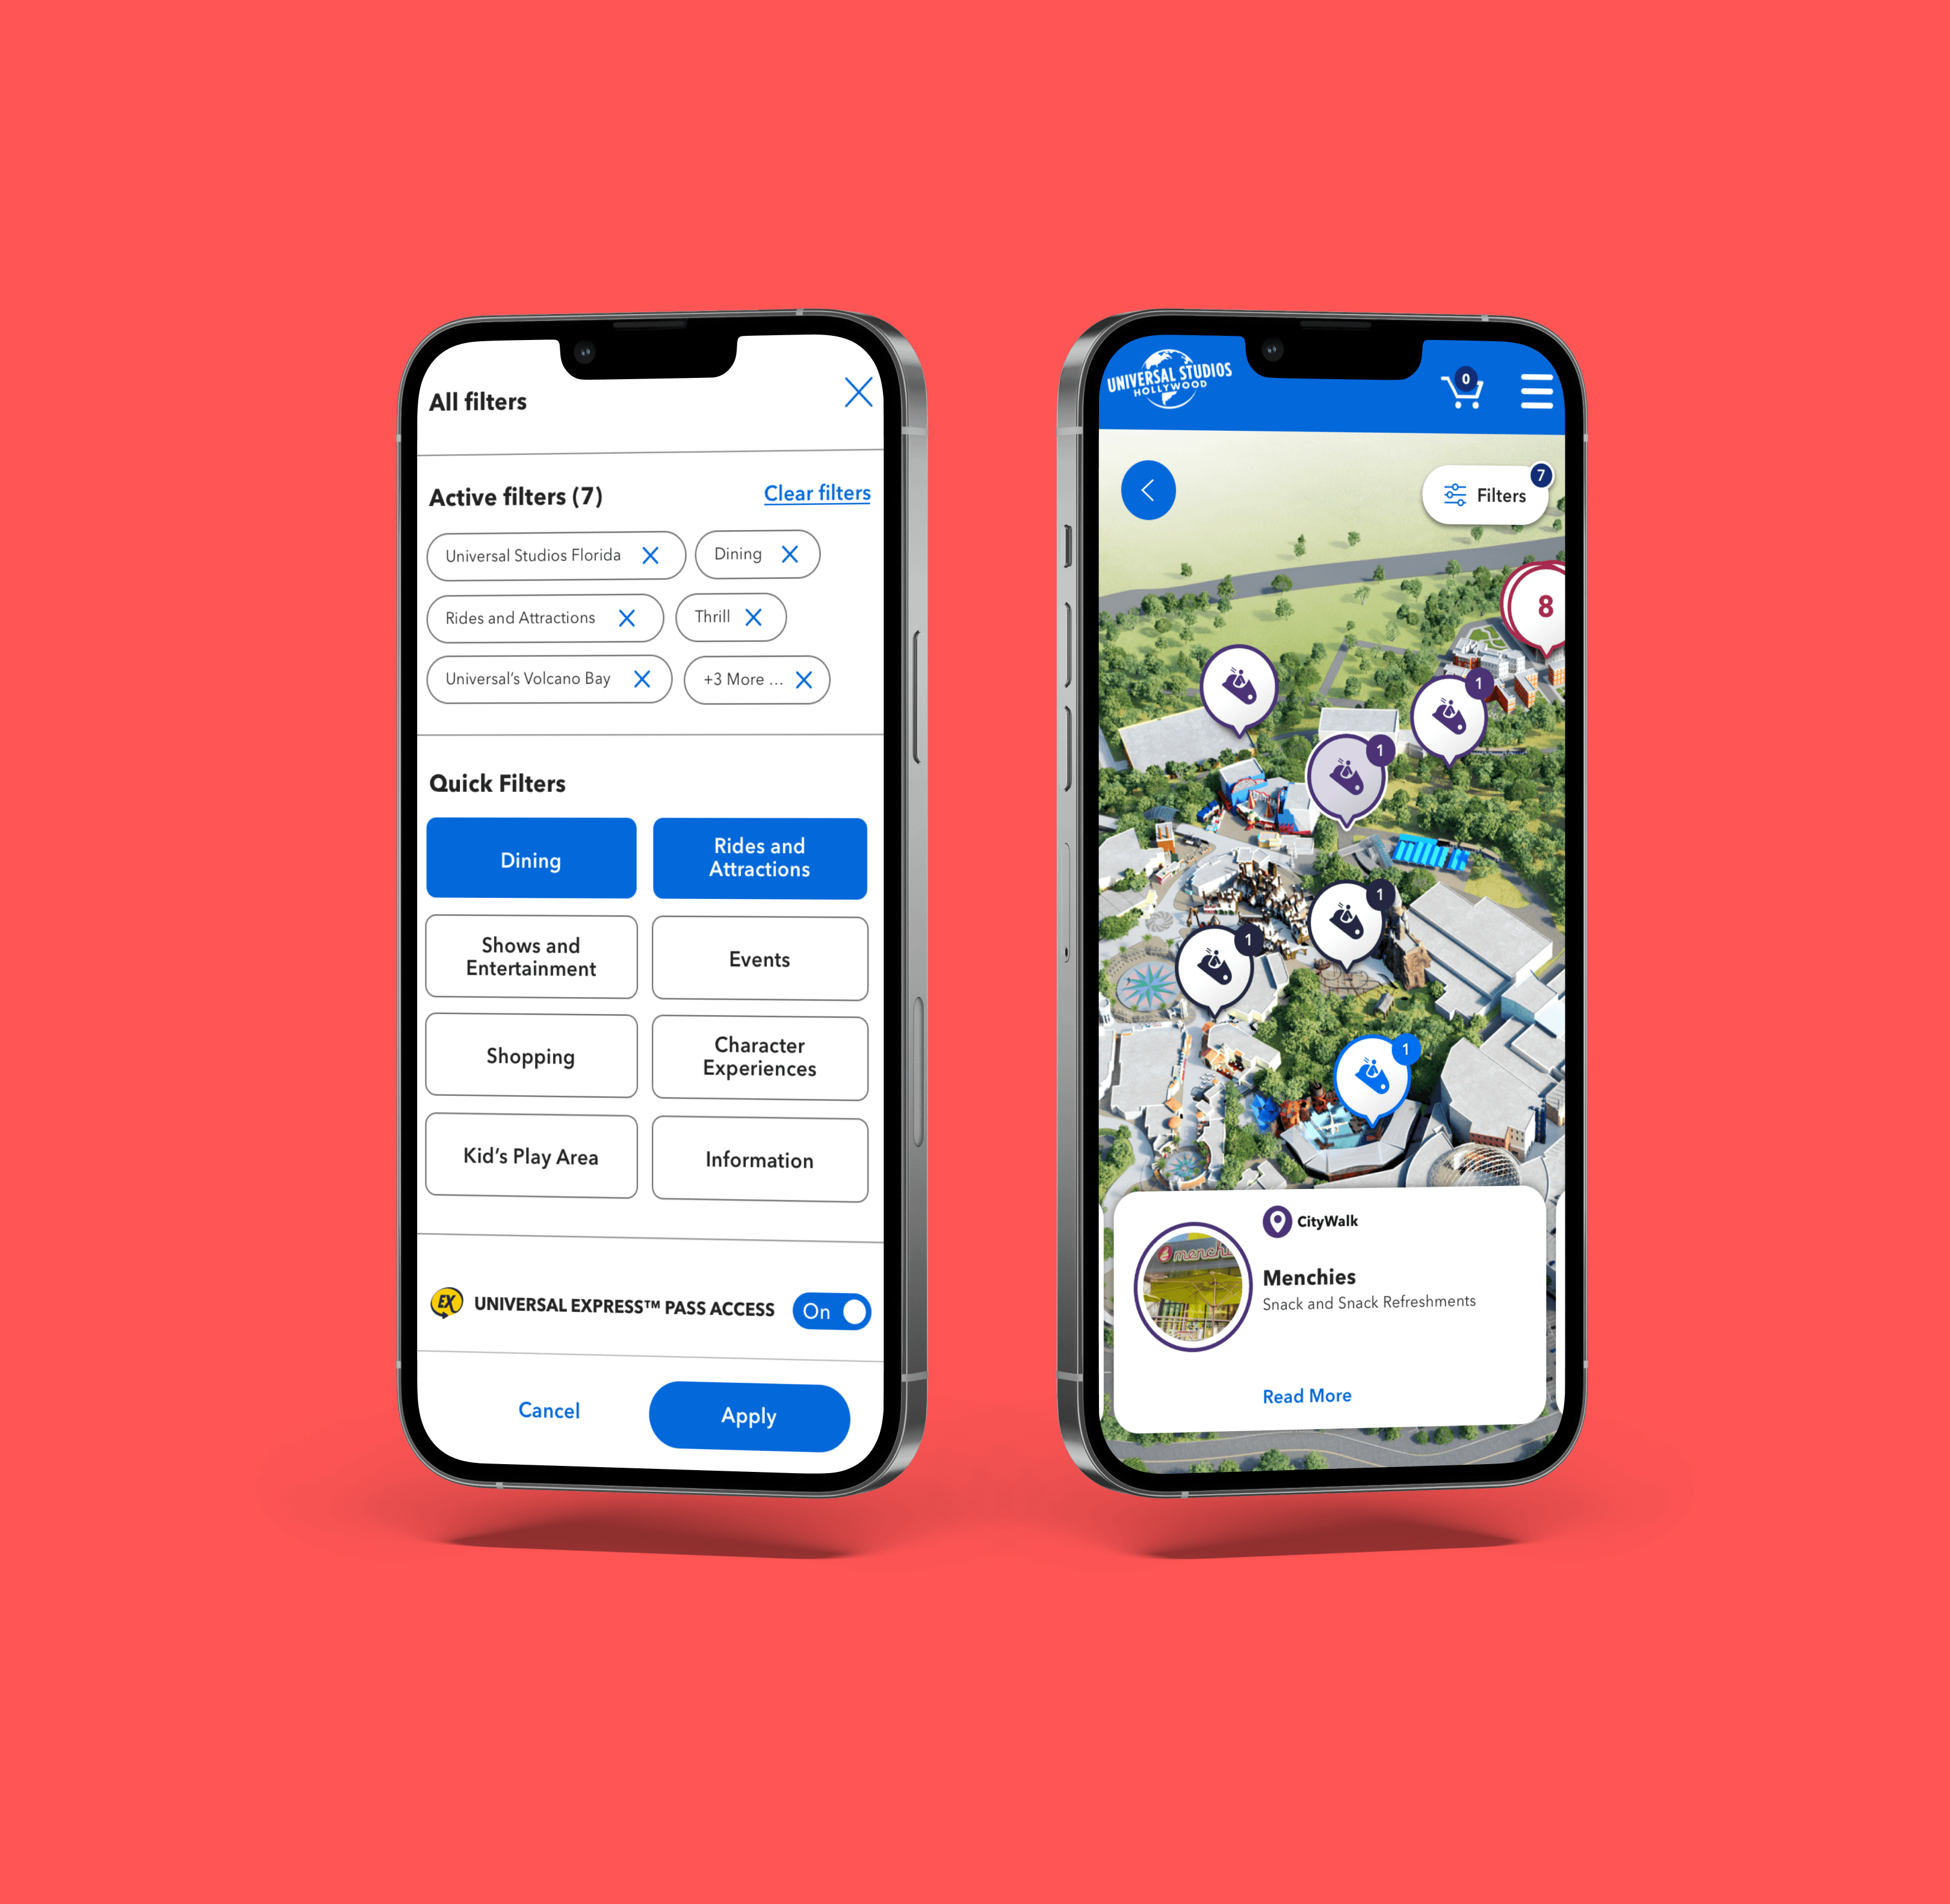
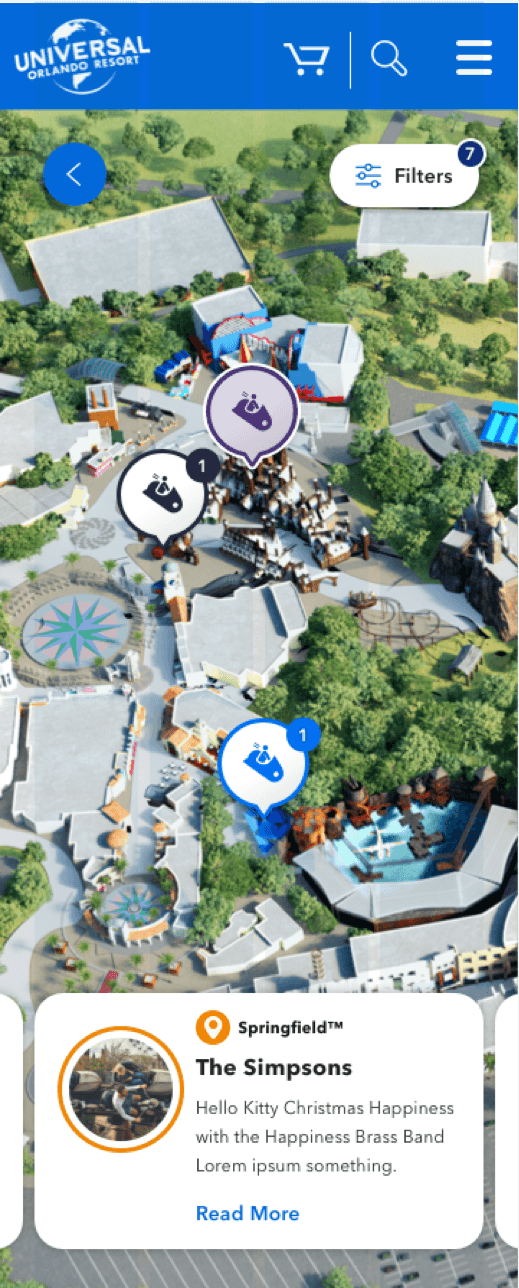
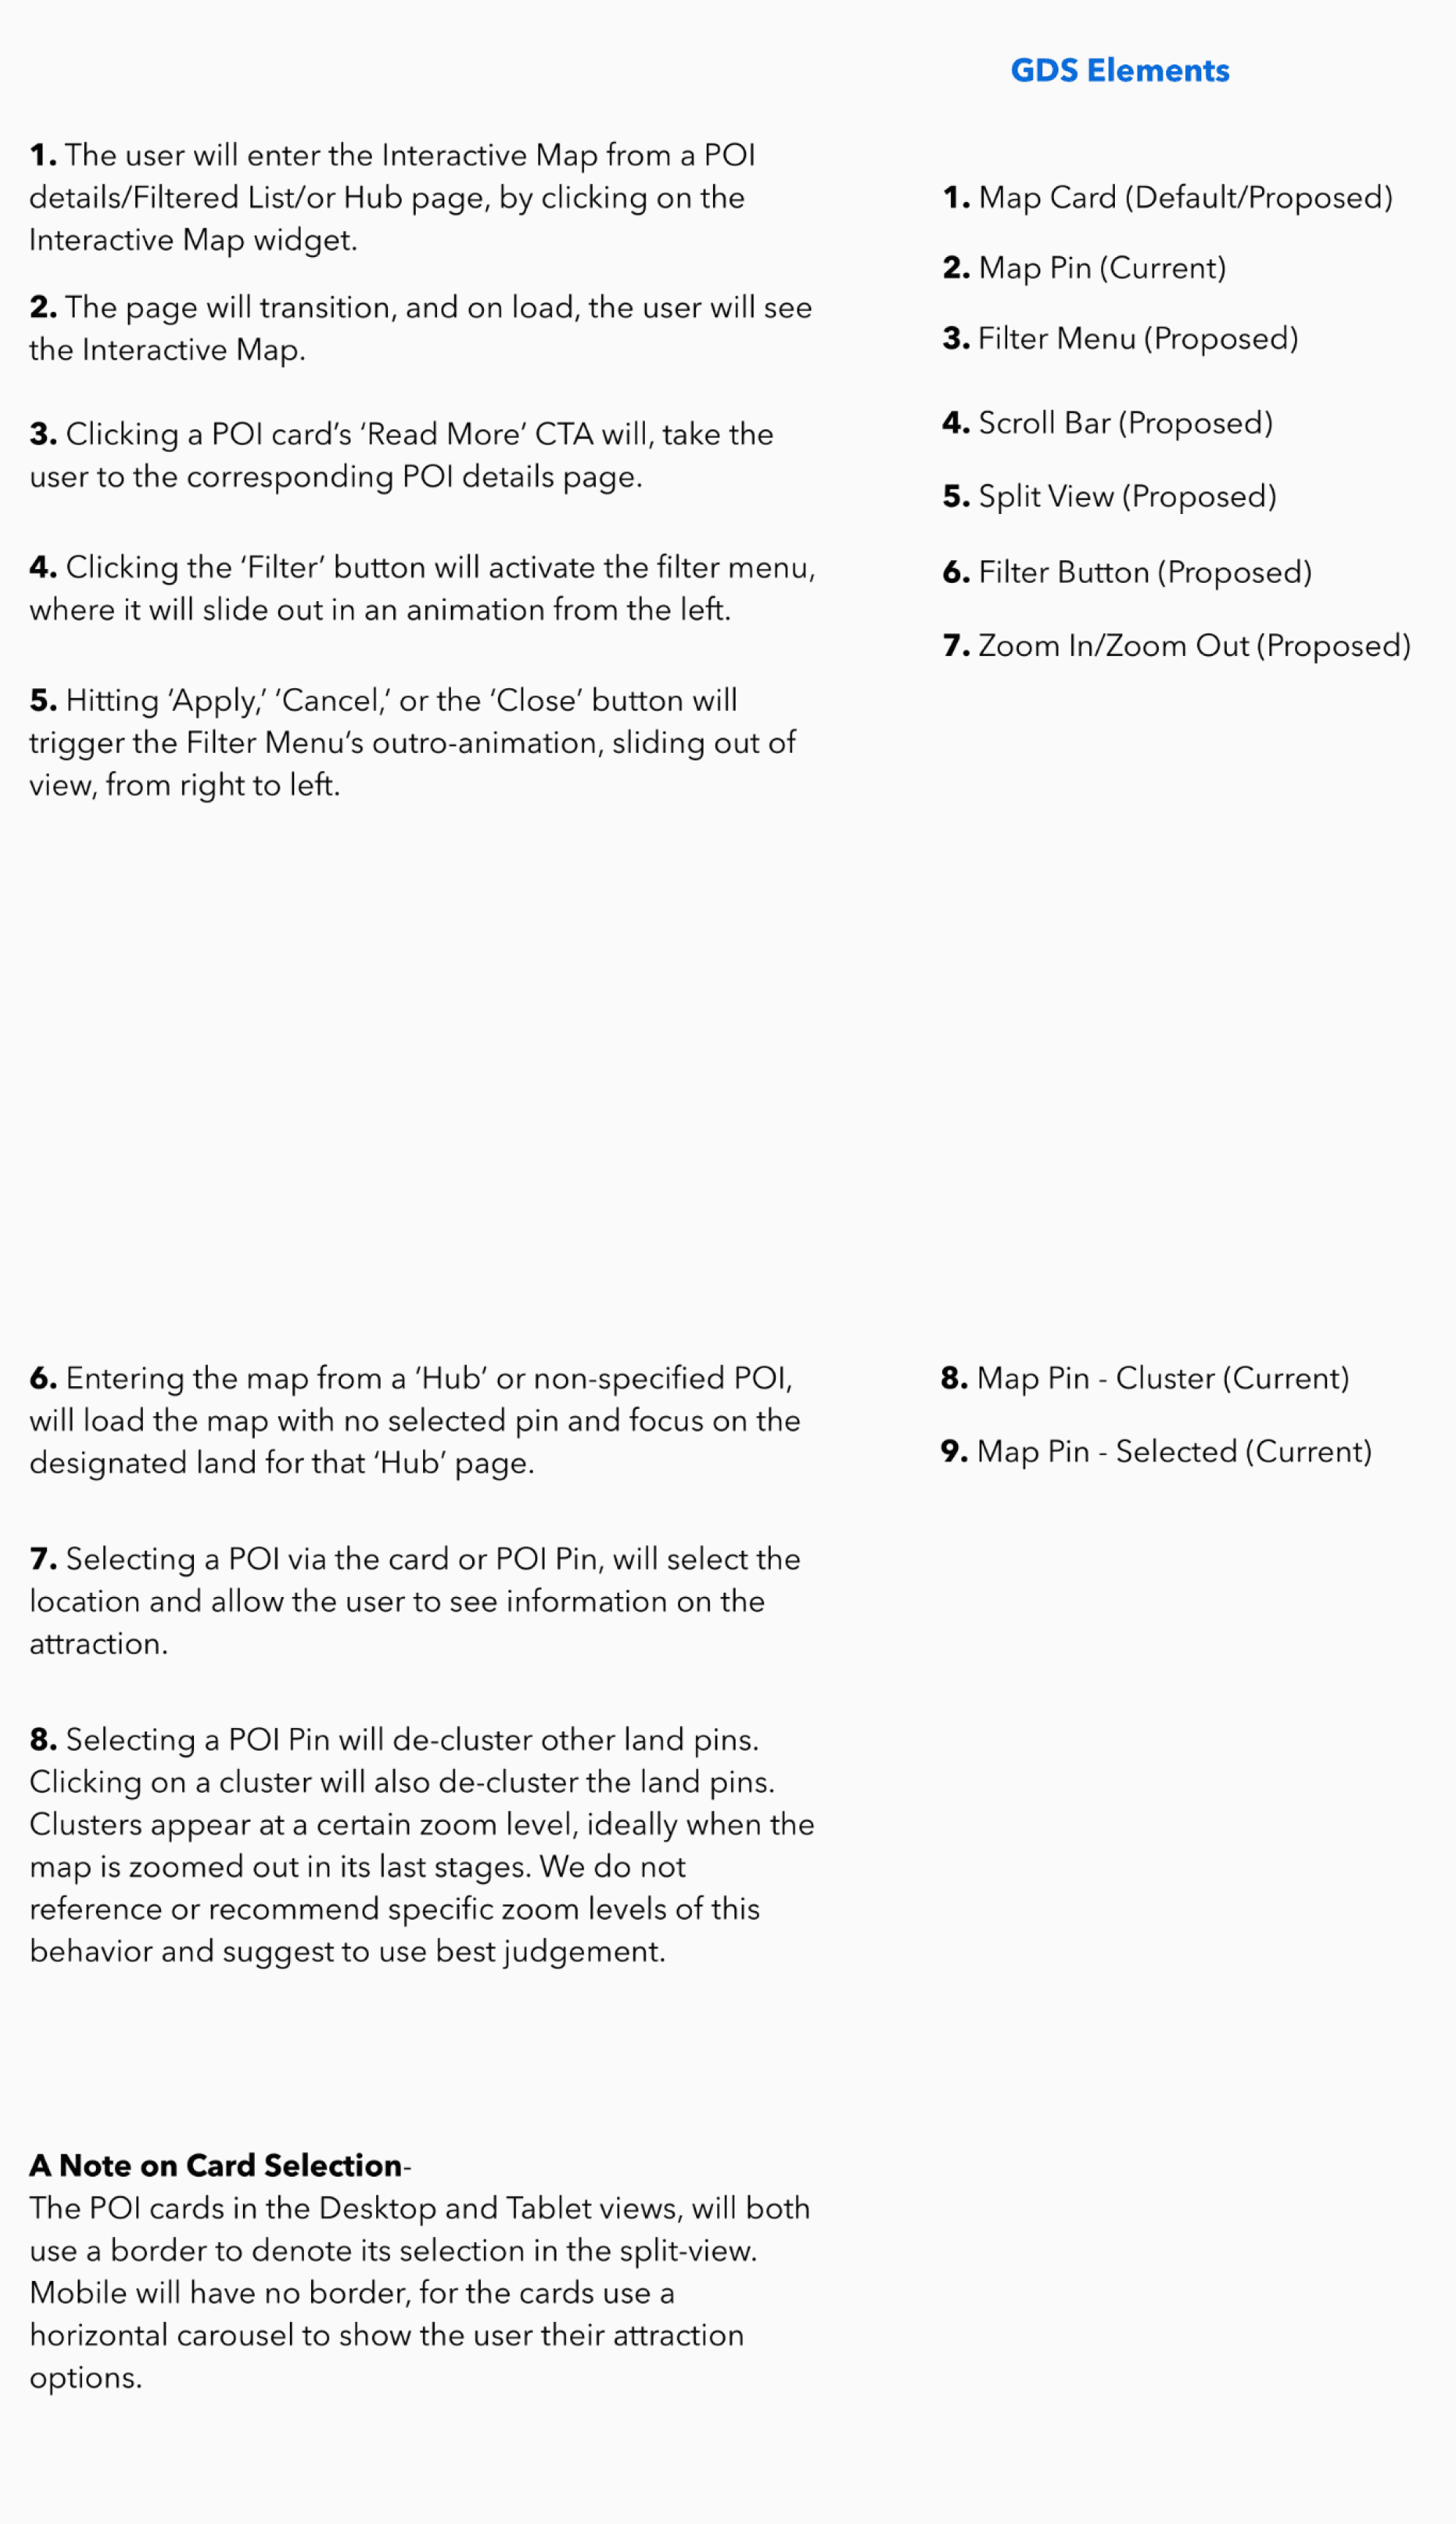
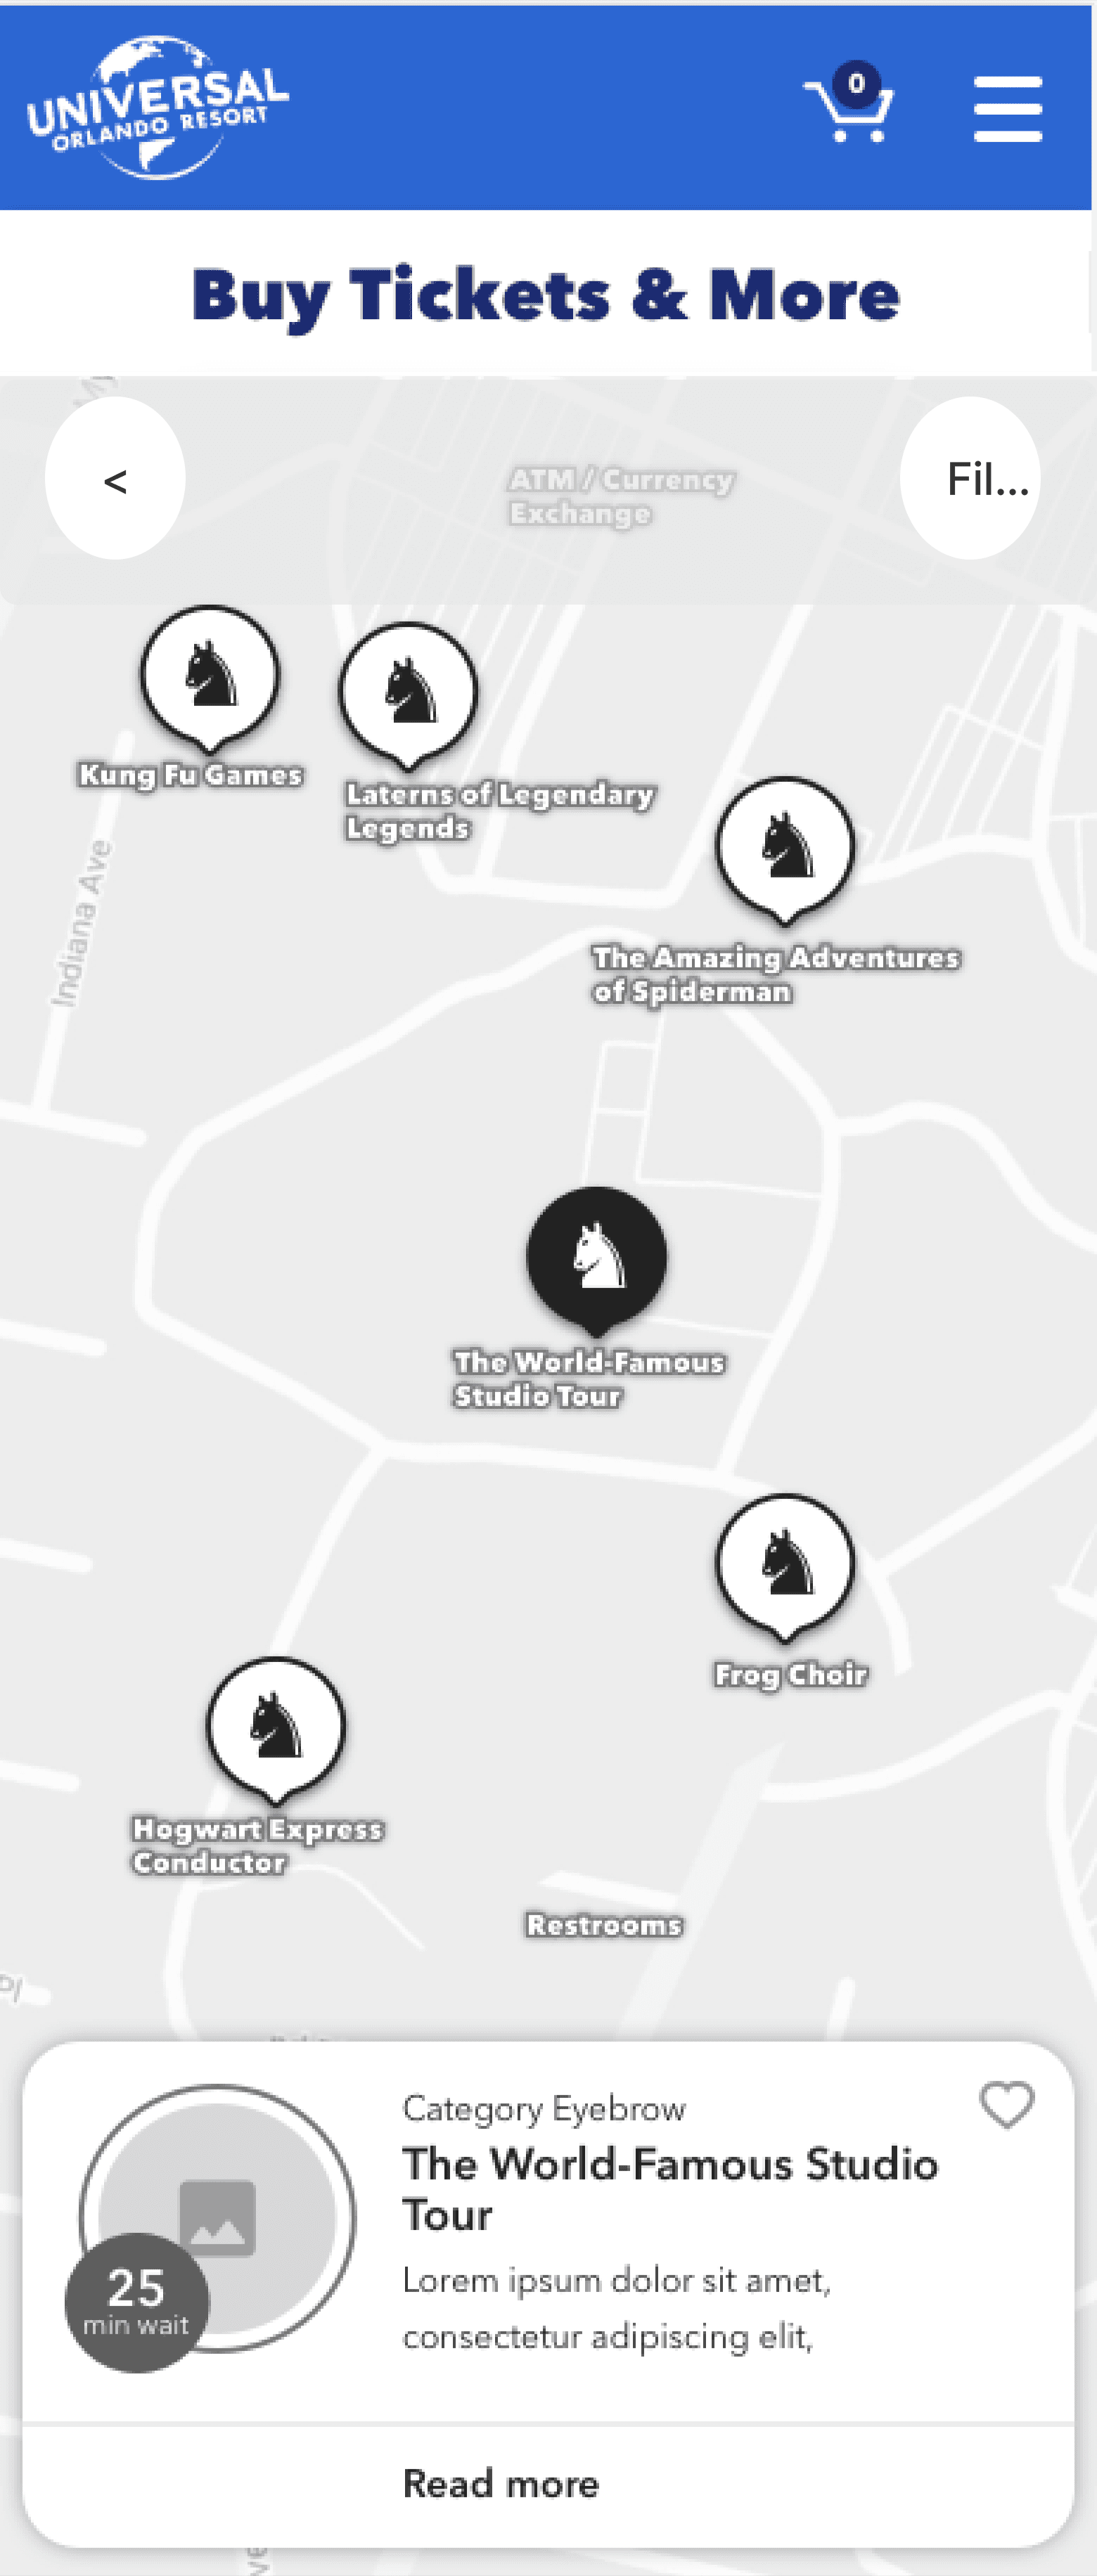
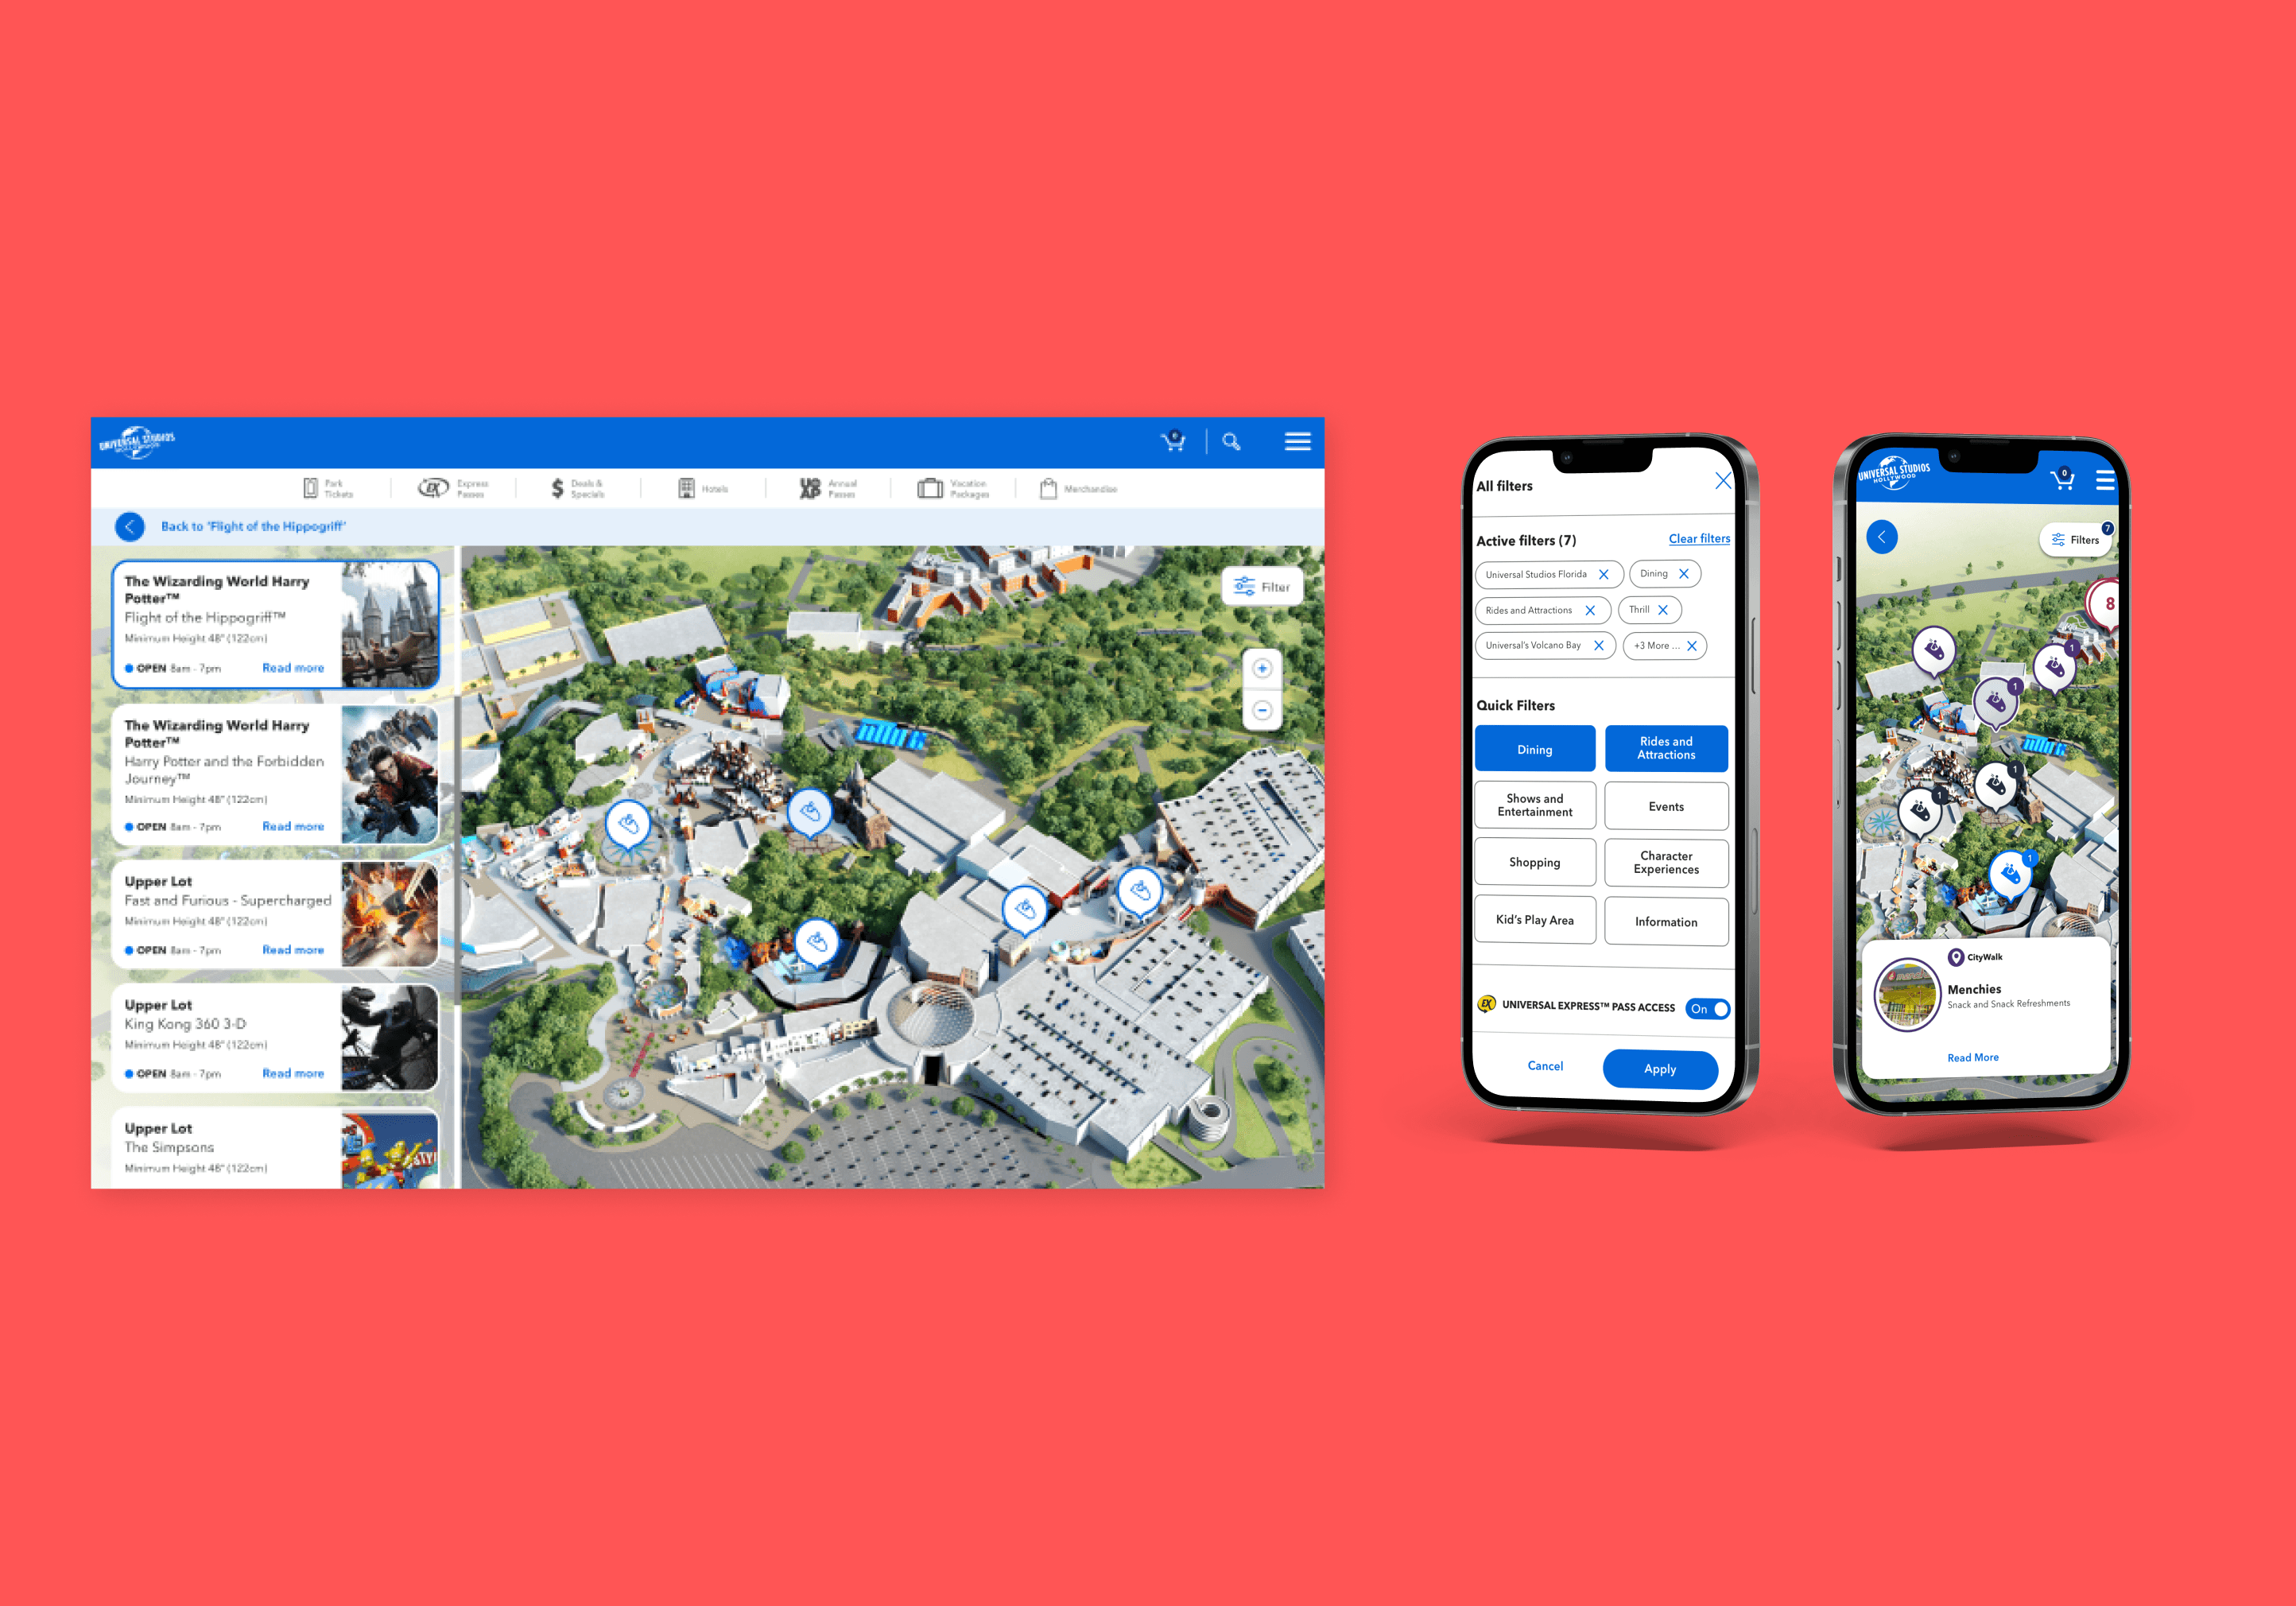
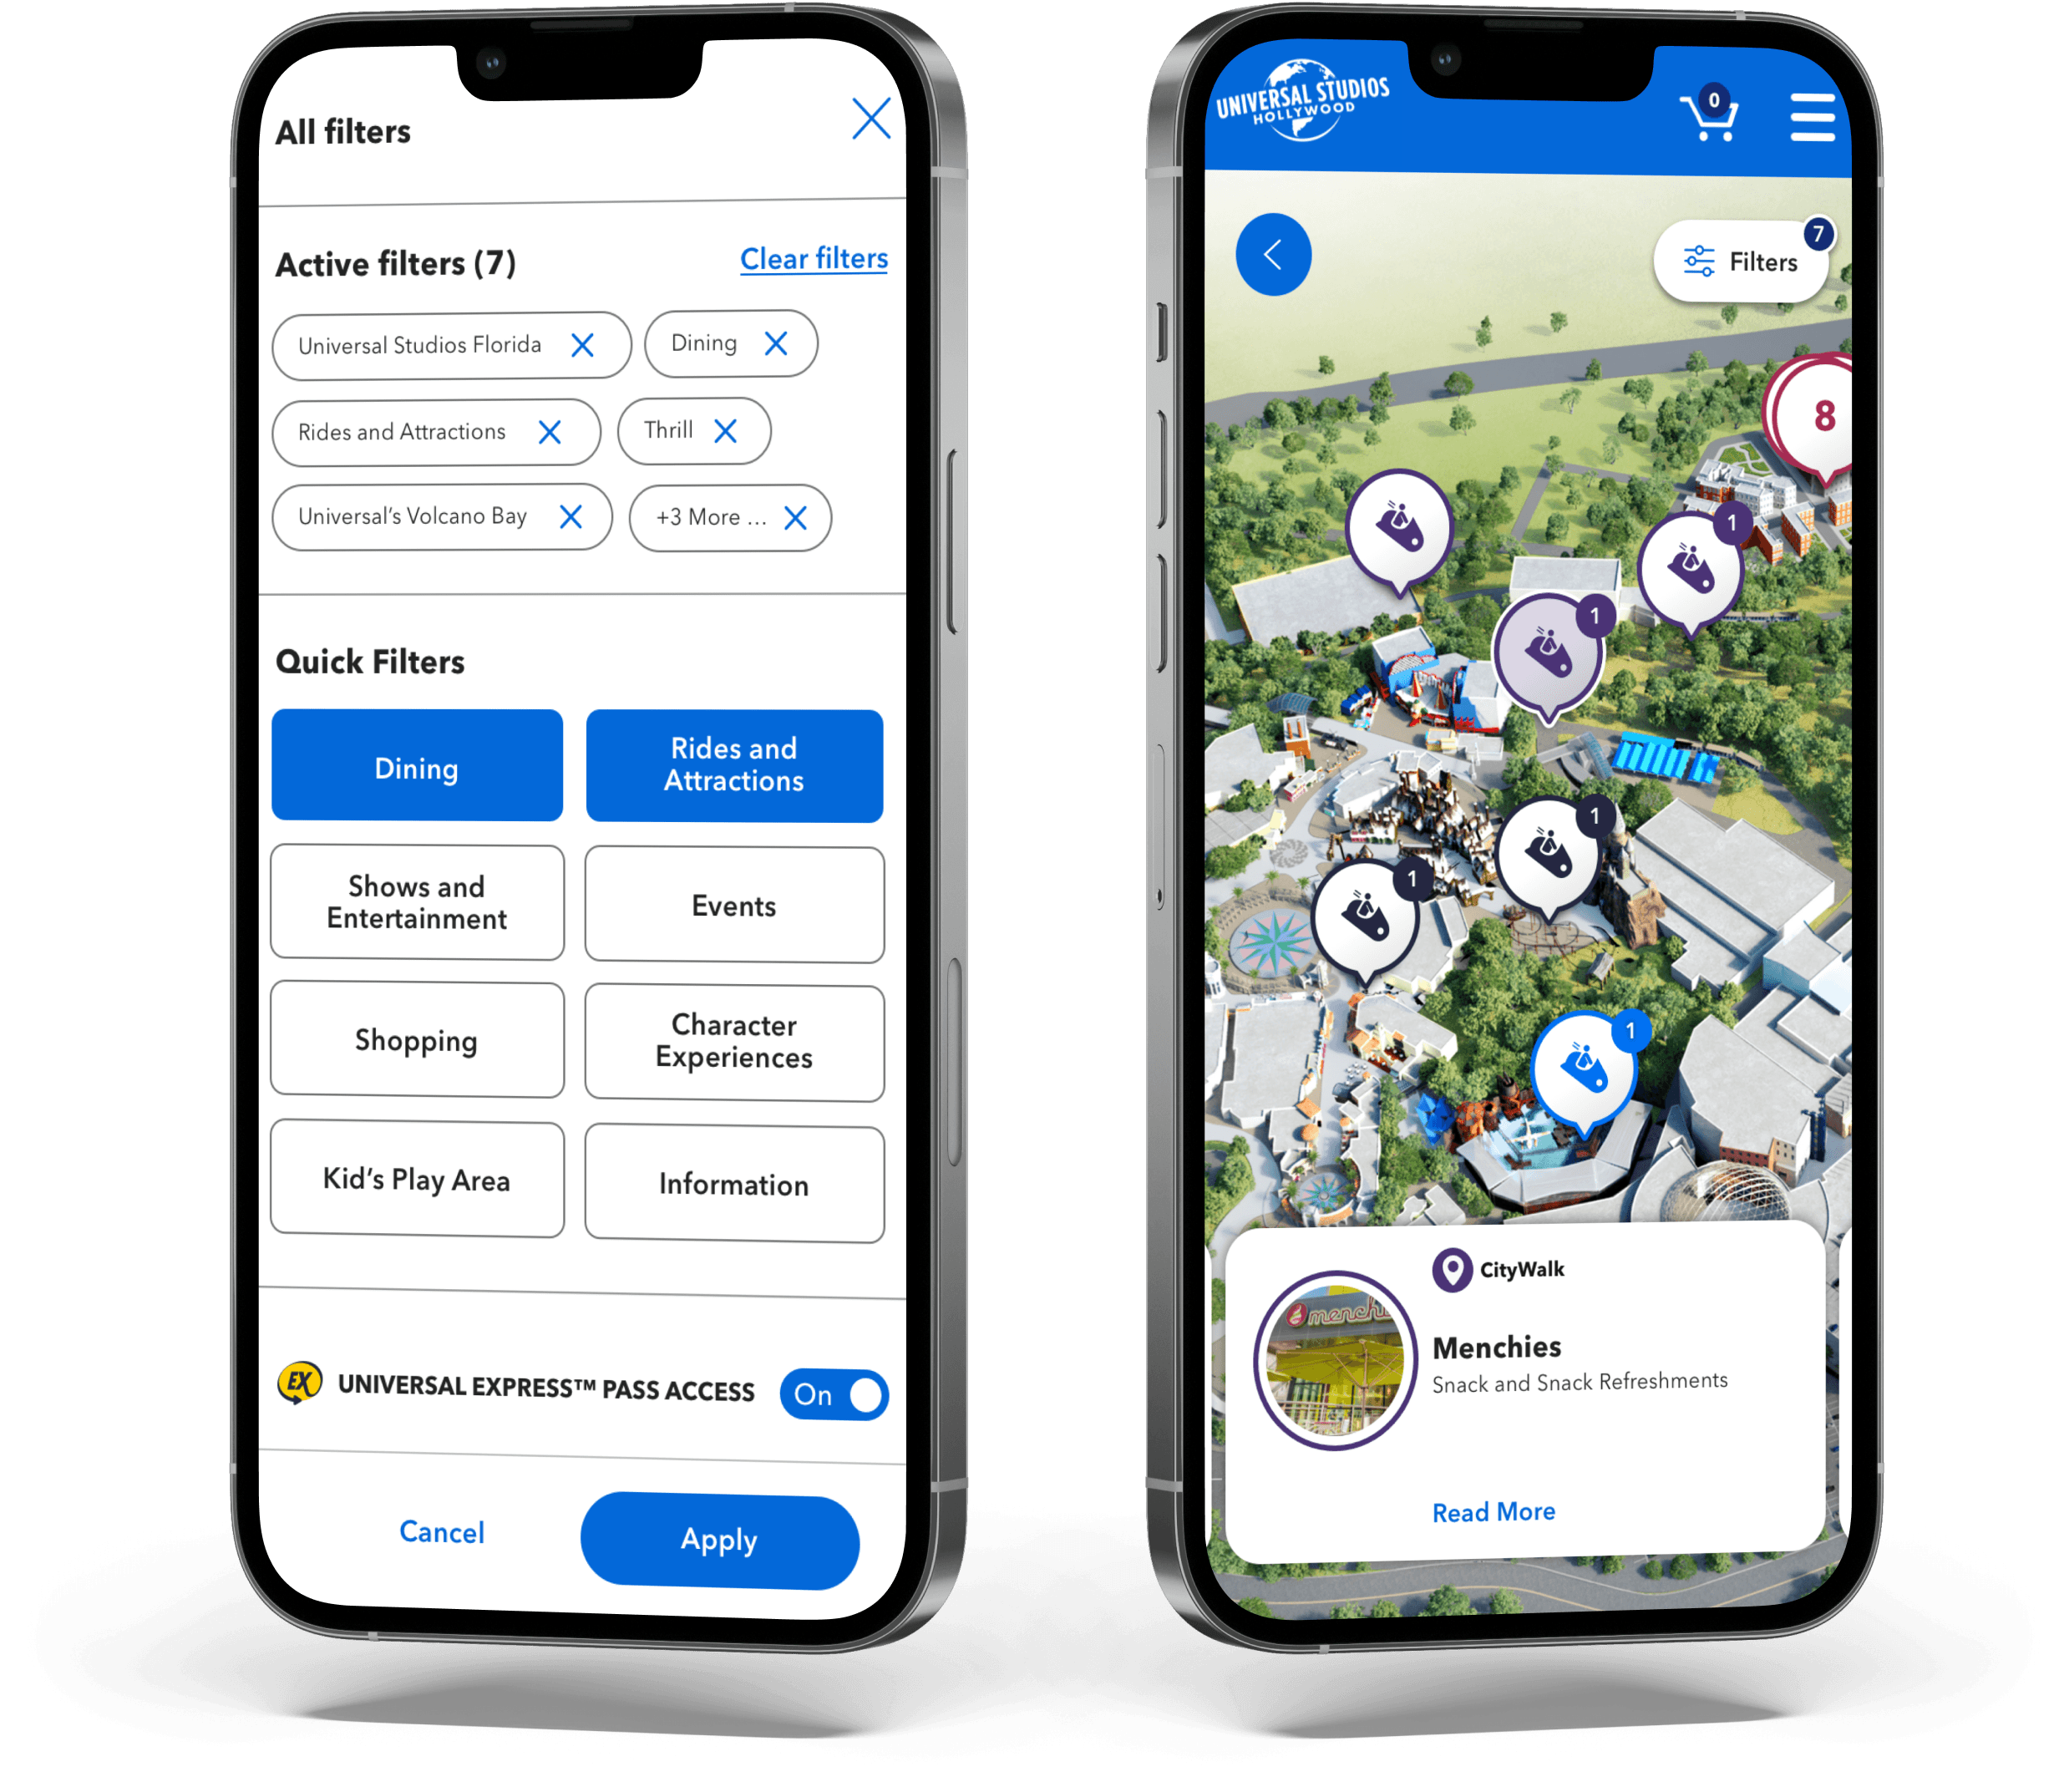
Universal Parks and Resorts’ Interactive Park Map, is a vital visual resource that allows prospective guests to plan their vacation.
Mission:
Universal Parks and Resorts heavily depended on an outdated interactive map on their website. My mission was to redesign it, adhering to modern design paradigms and accessibility standards.
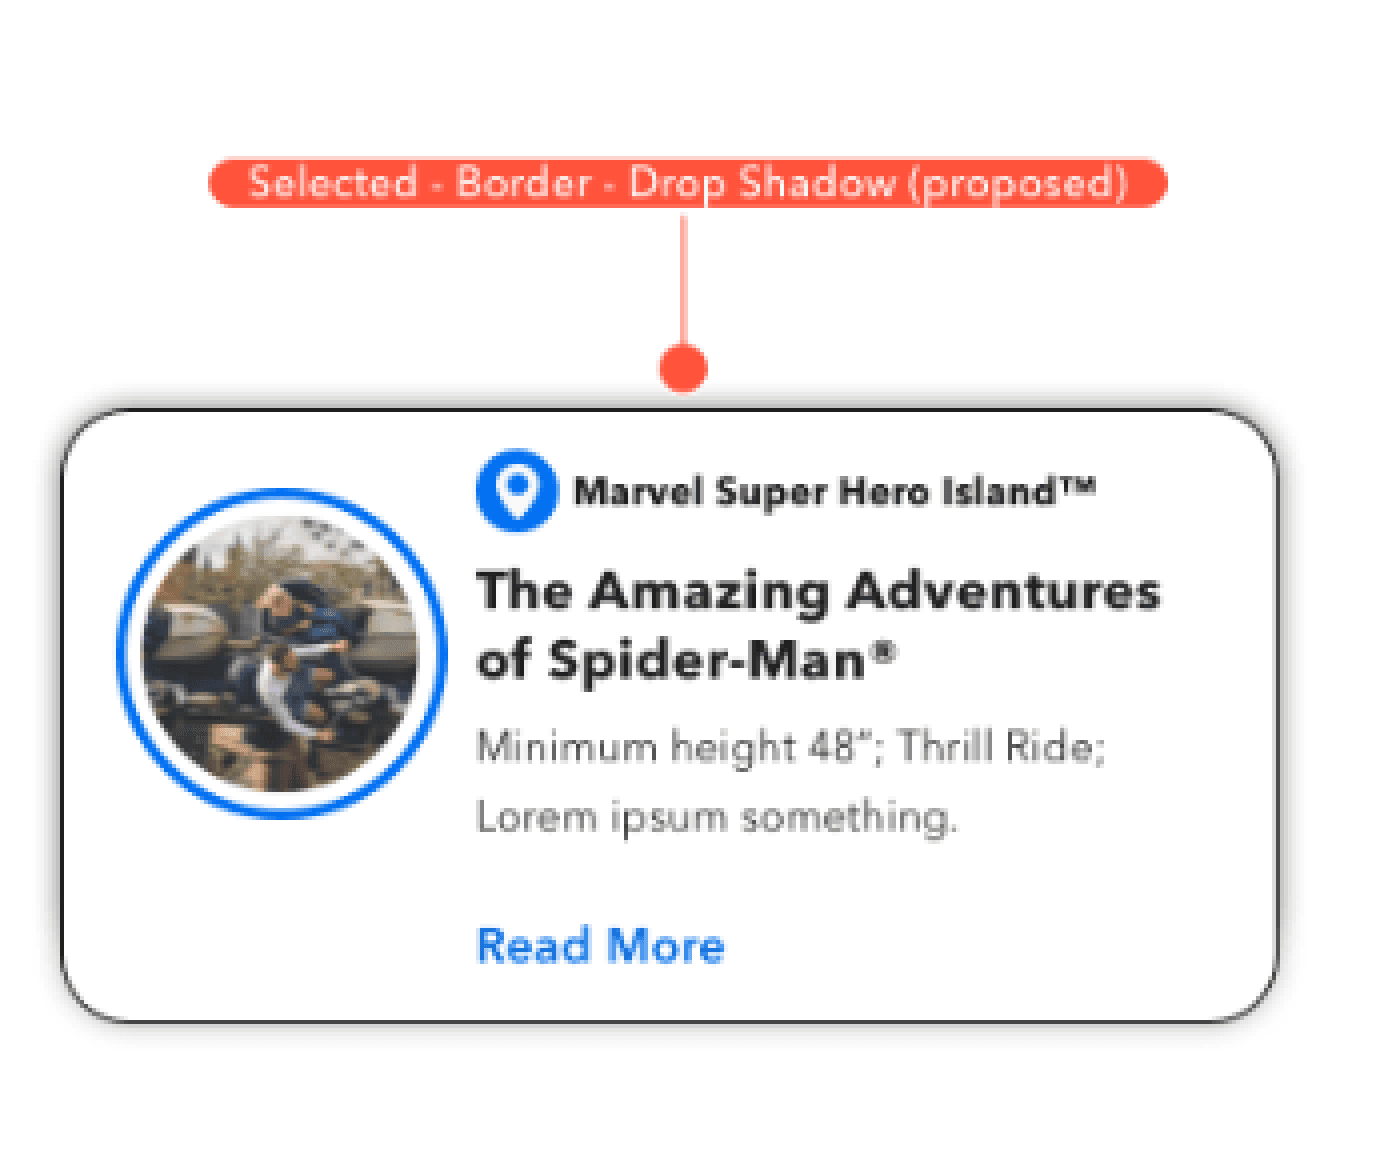
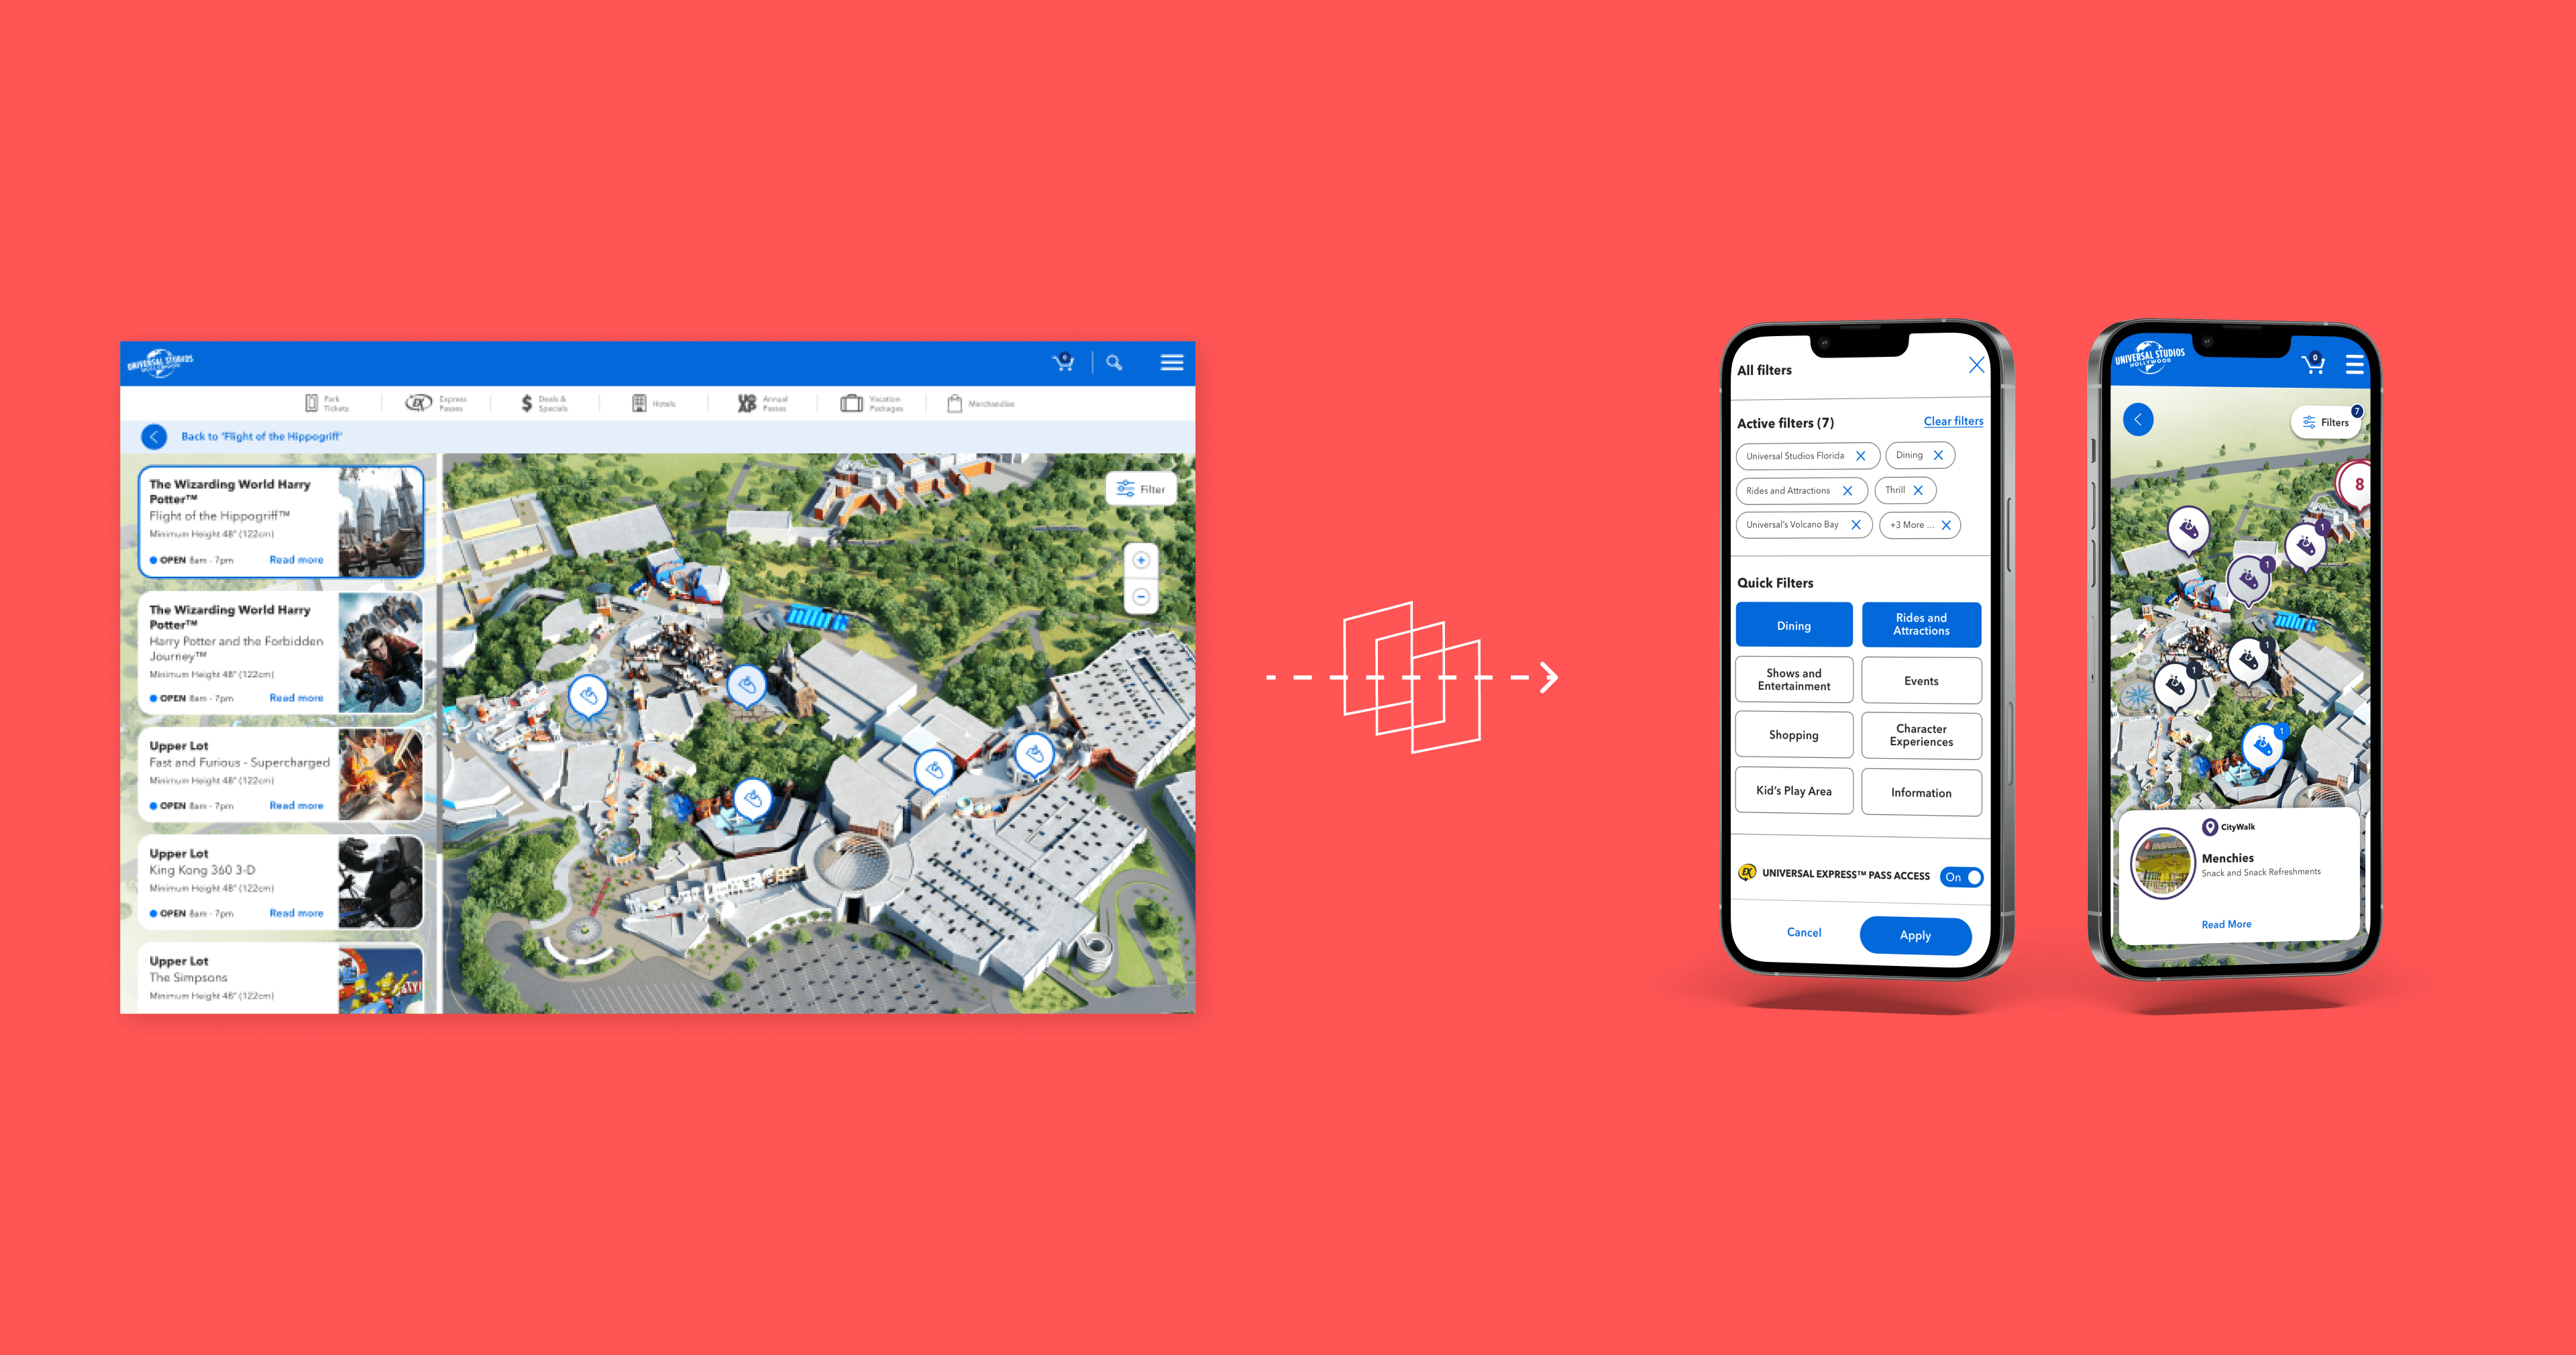
I tackled the redesign of an interactive tool using a pre-existing design system that I was encountering for the first time:
• This project marked the first update to the interactive map since the early 2000s, presenting a vast landscape of immersion and ideation.
• I led the ideation on this cross functional design project, collaborating on a cross-company level and integrating an external design system into my workflow.
How might we create an interactive map that enables first-time guests to Universal to easily discover points of interest (POIs) and learn about what the park offers before their visit?
I engaged with Universal product leads and internal designers to understand their design objectives and product principles while using their Global Design System (GDS).
Competitive Analysis/Research
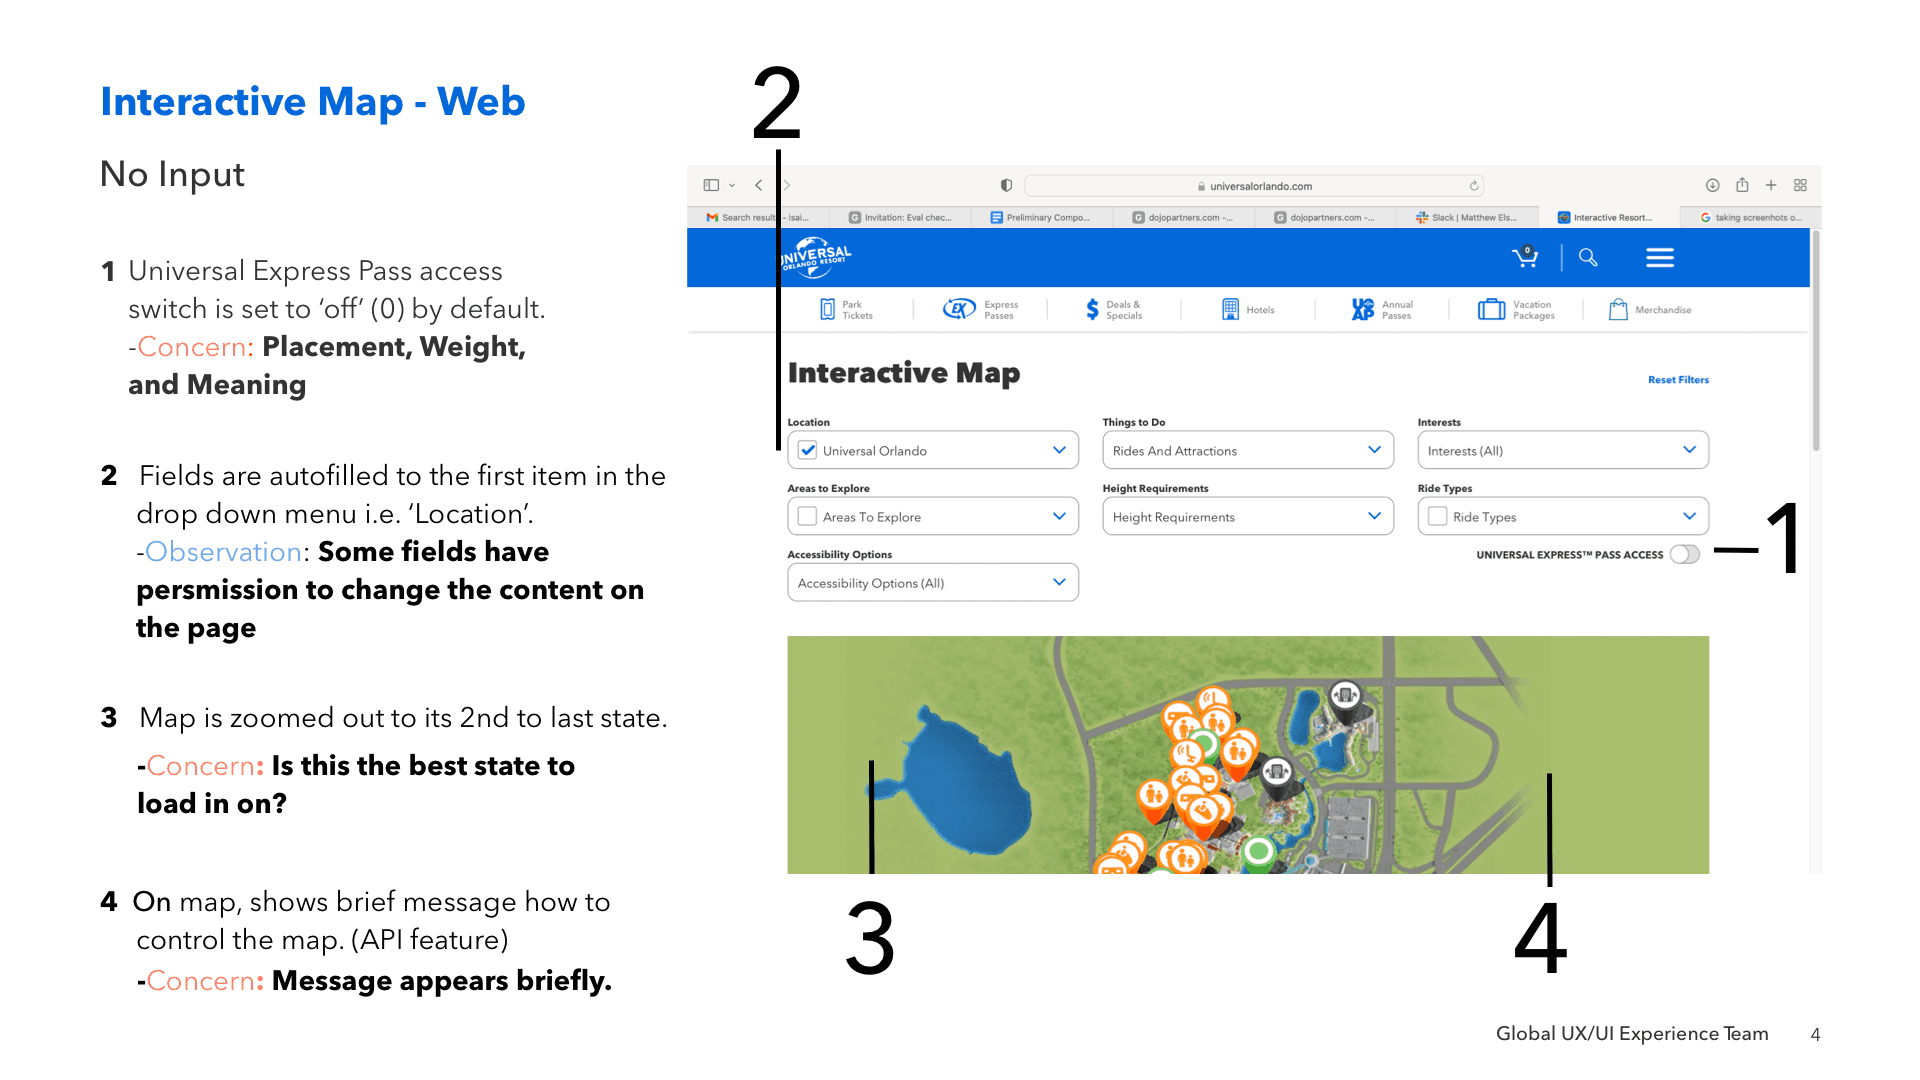
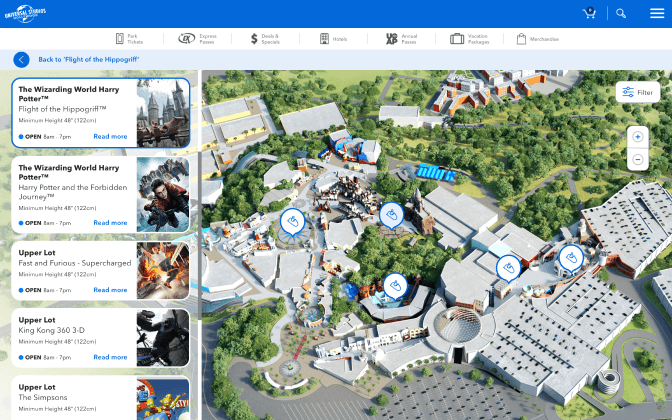
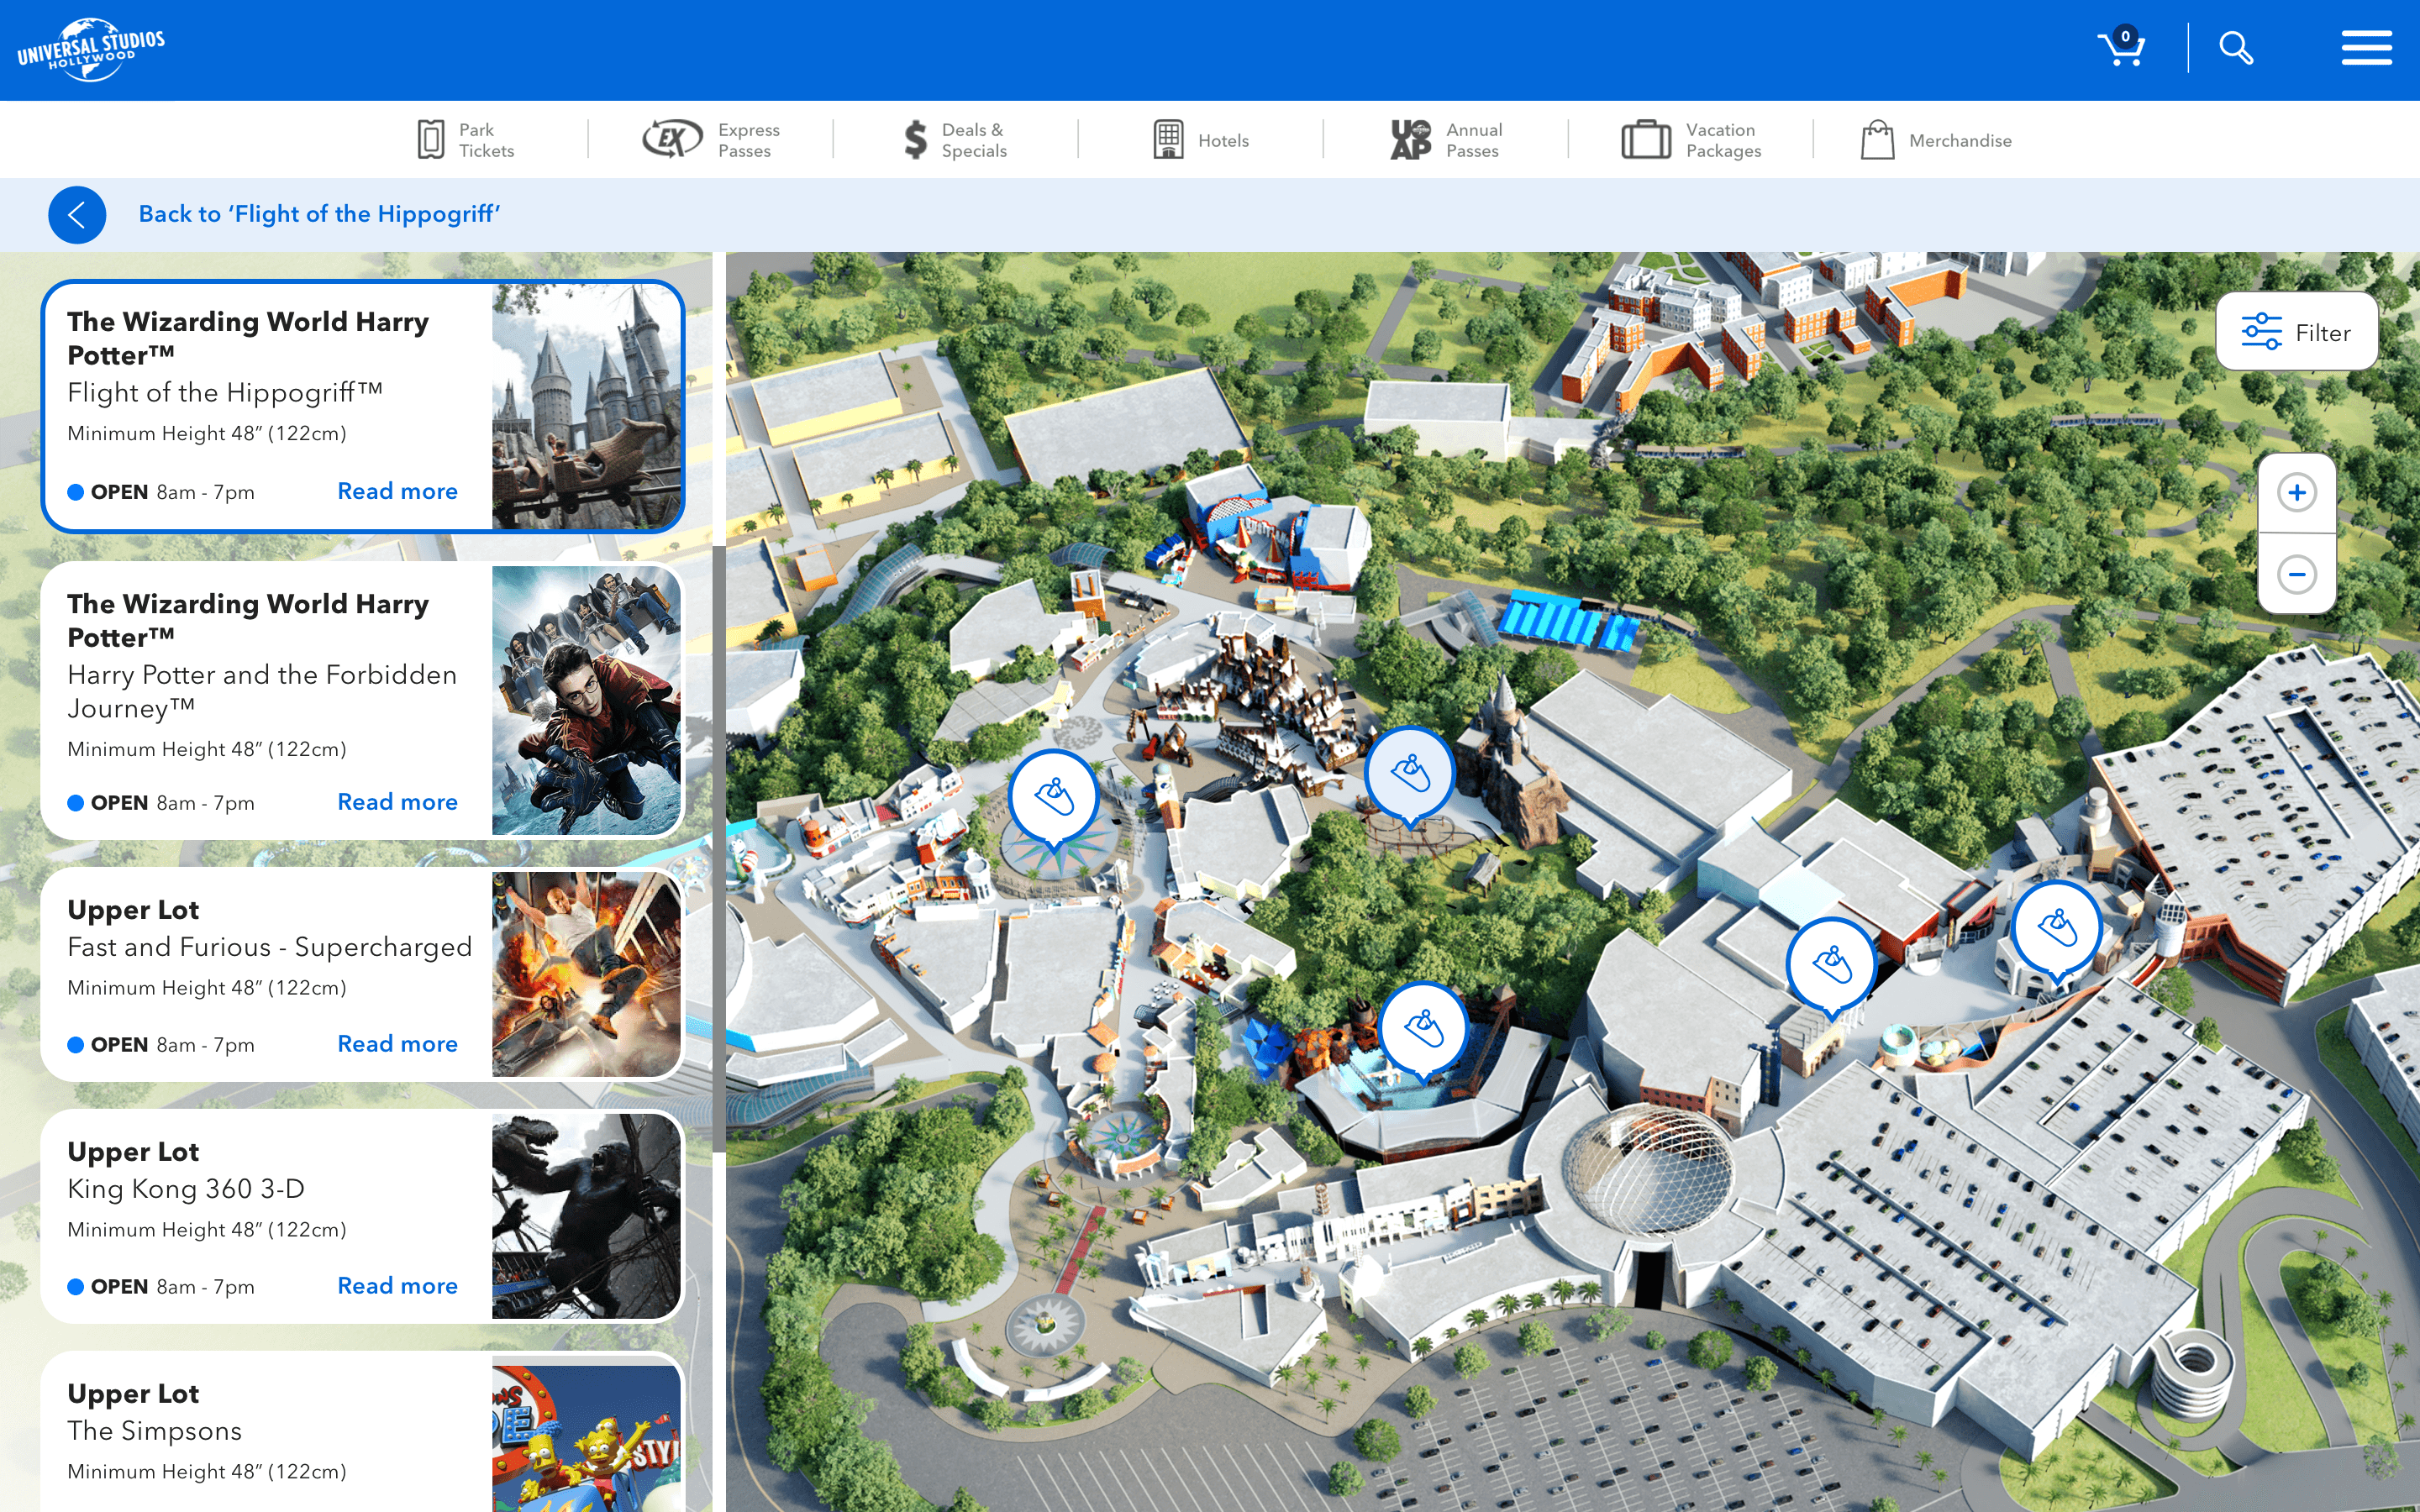
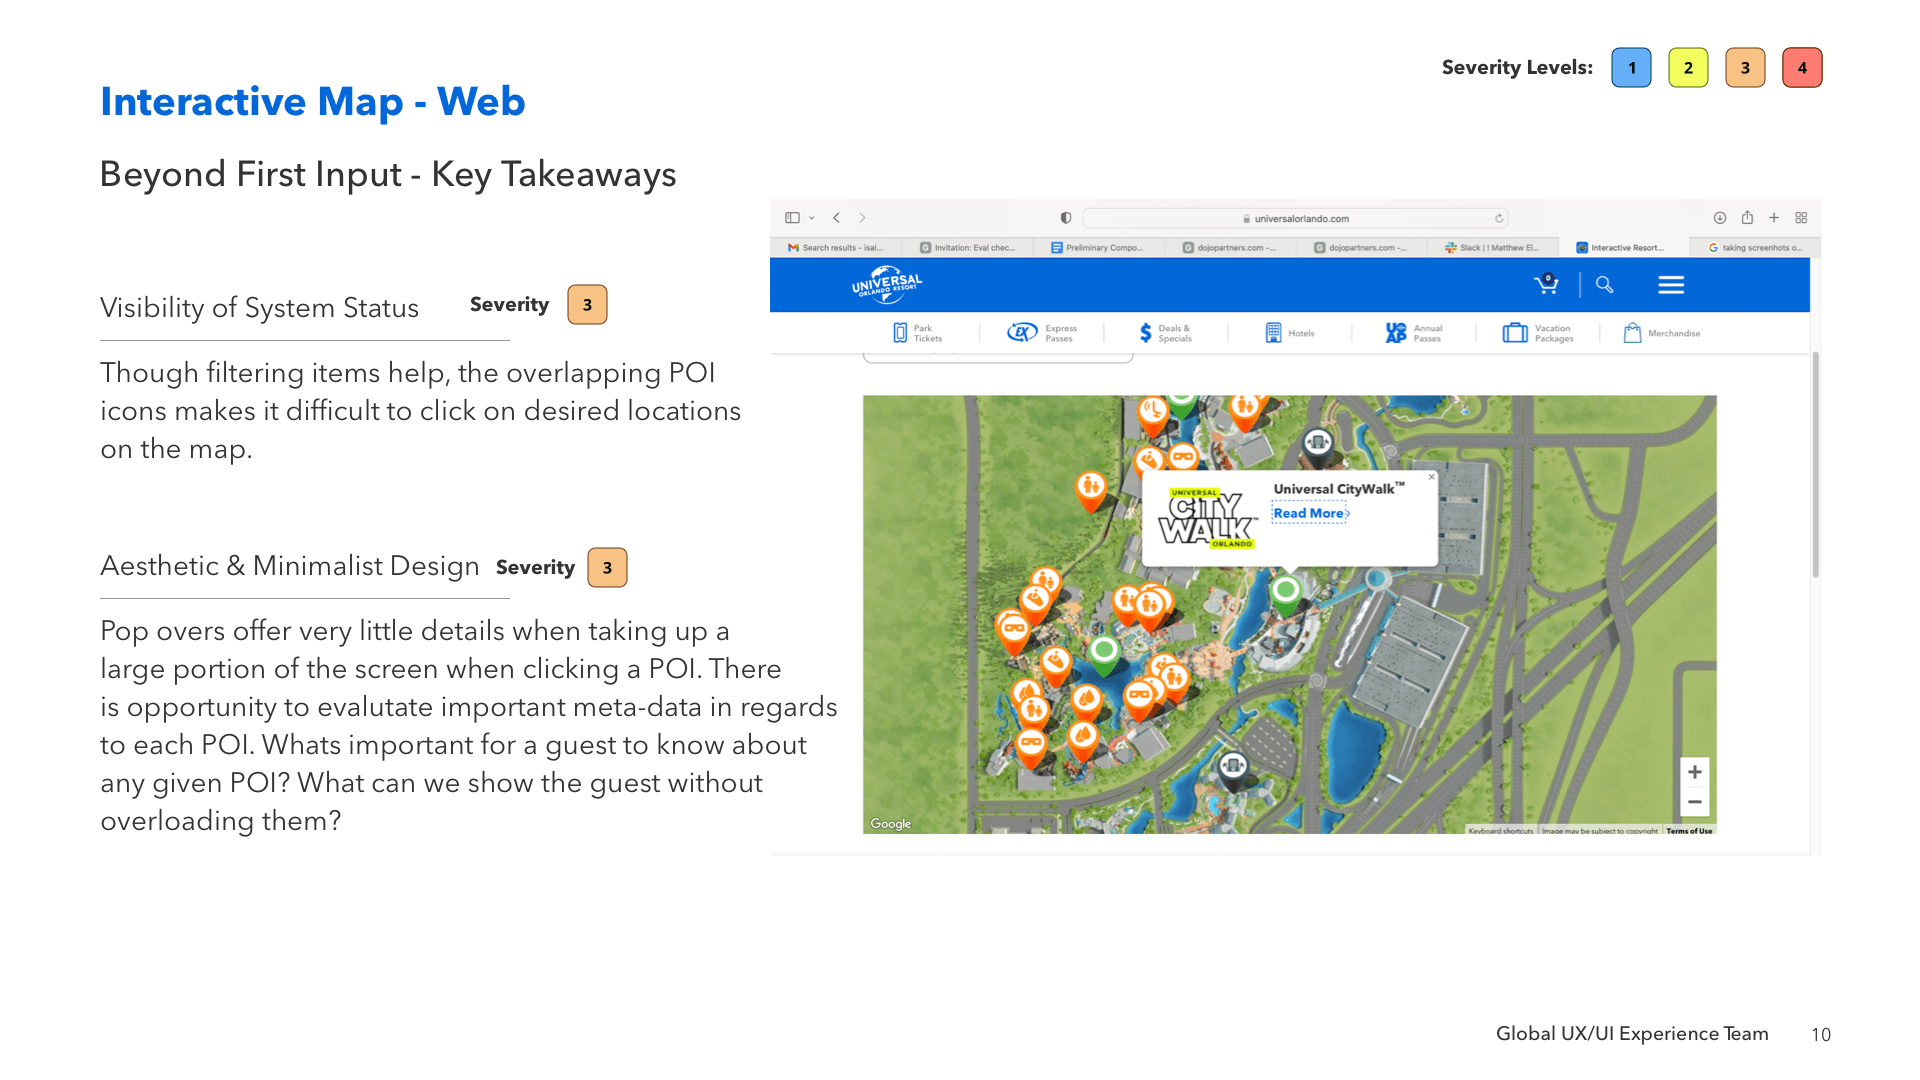
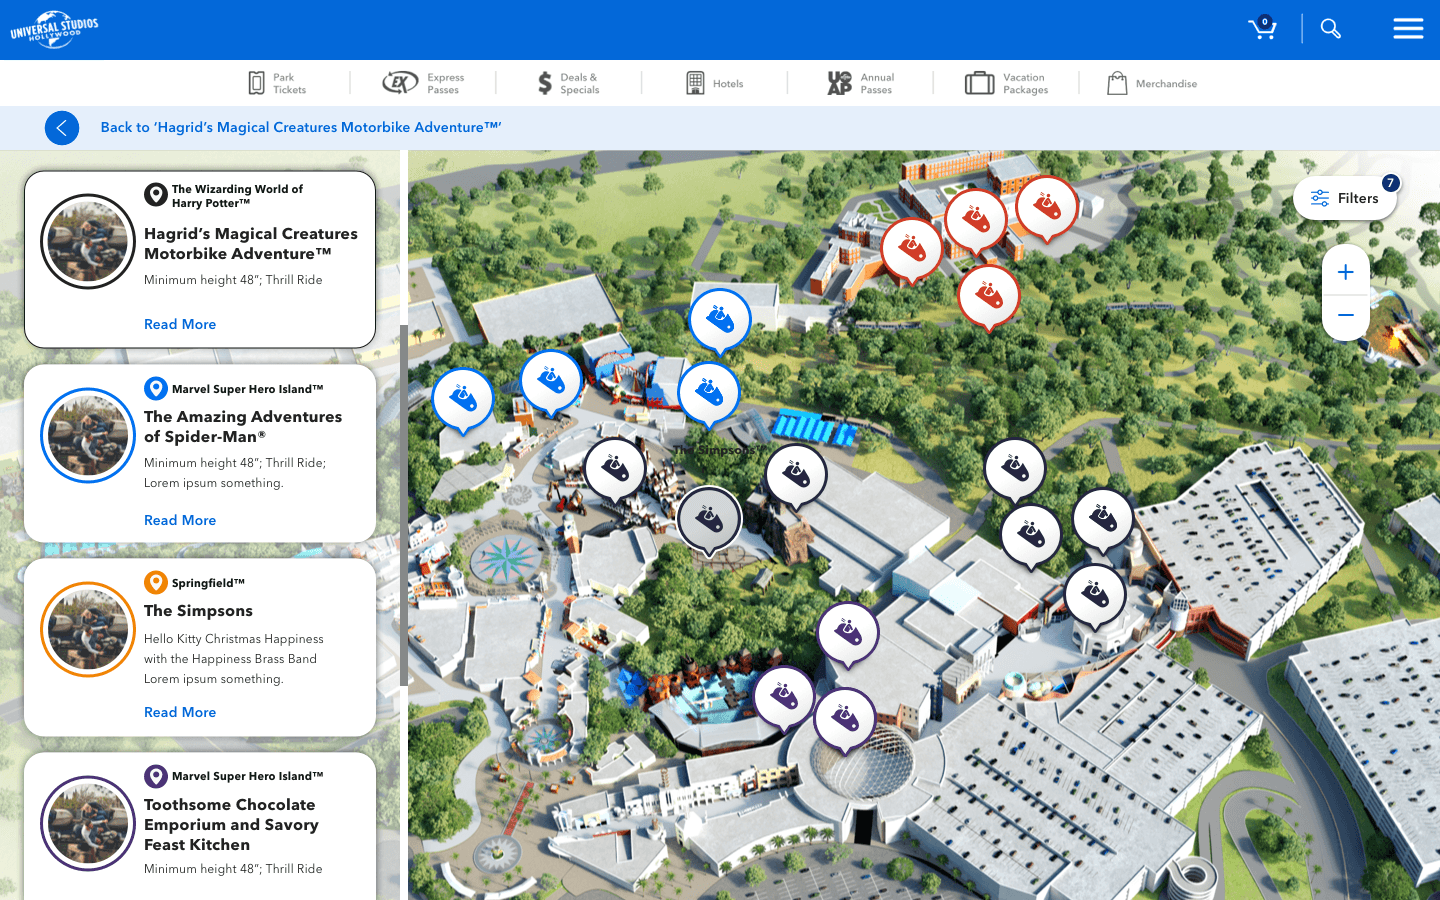
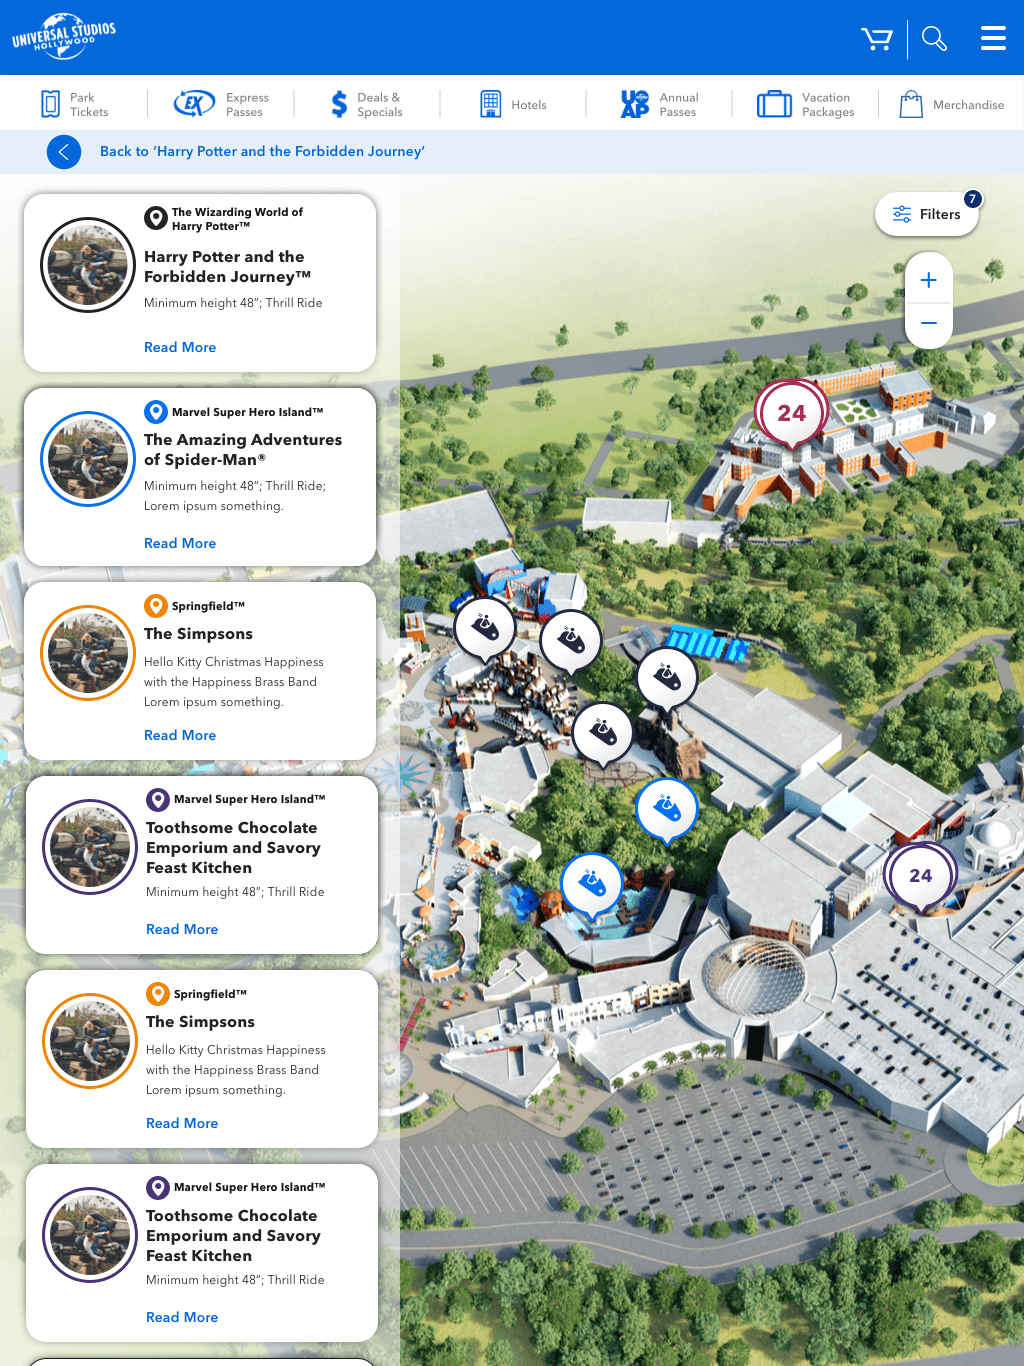
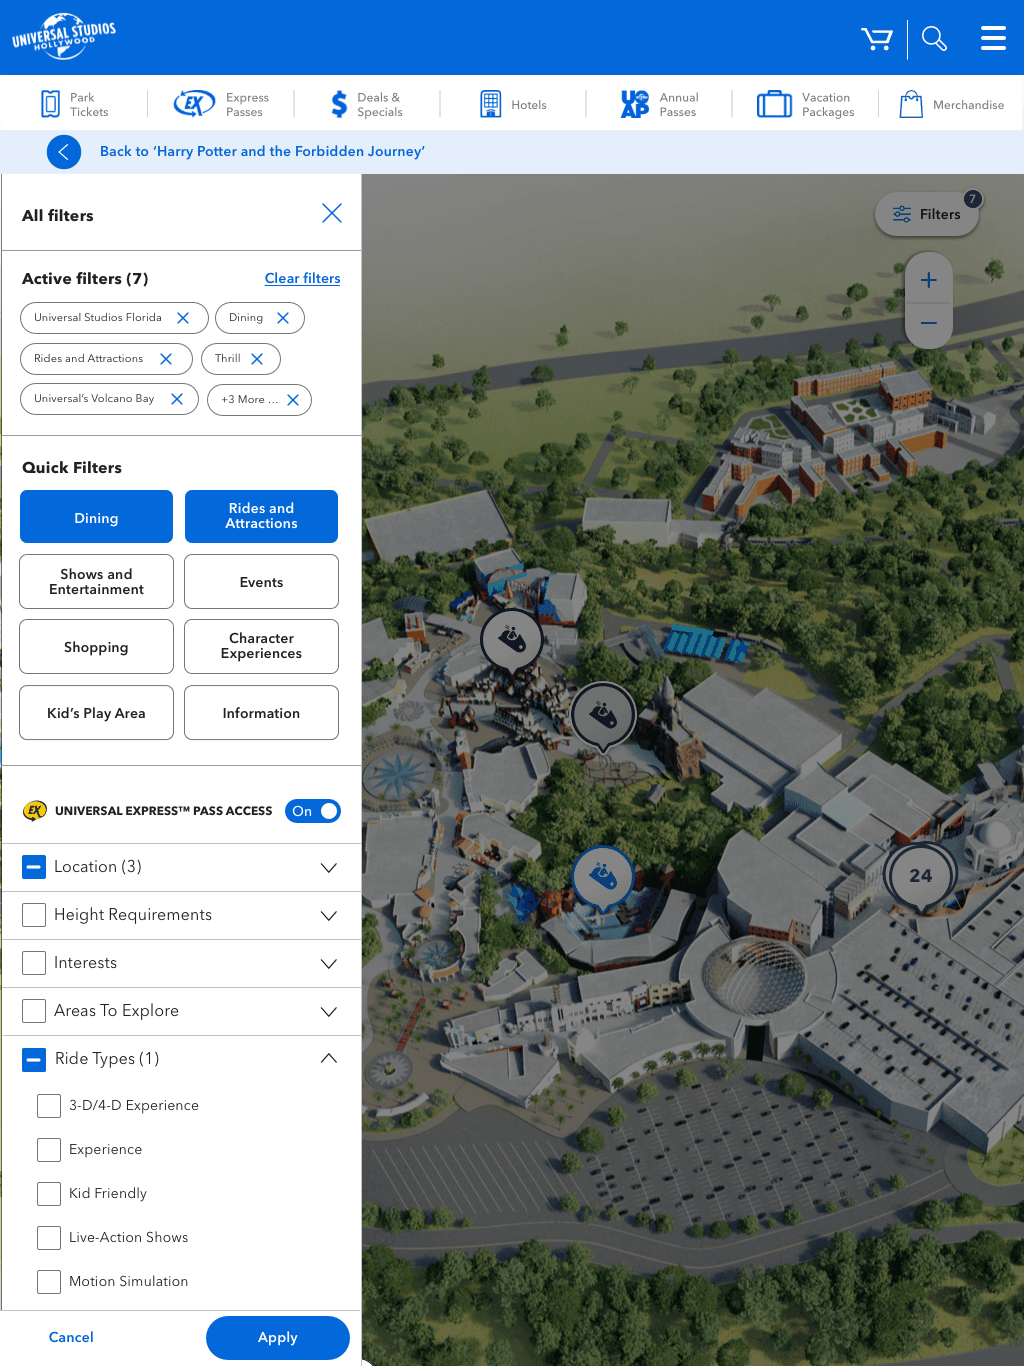
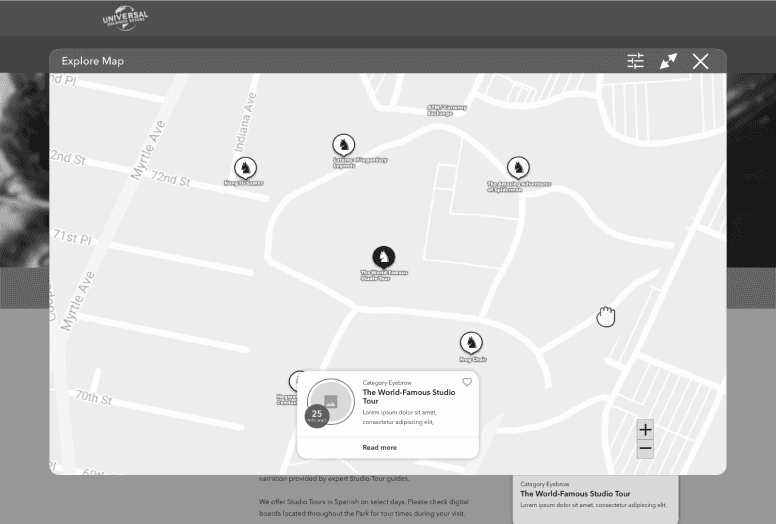
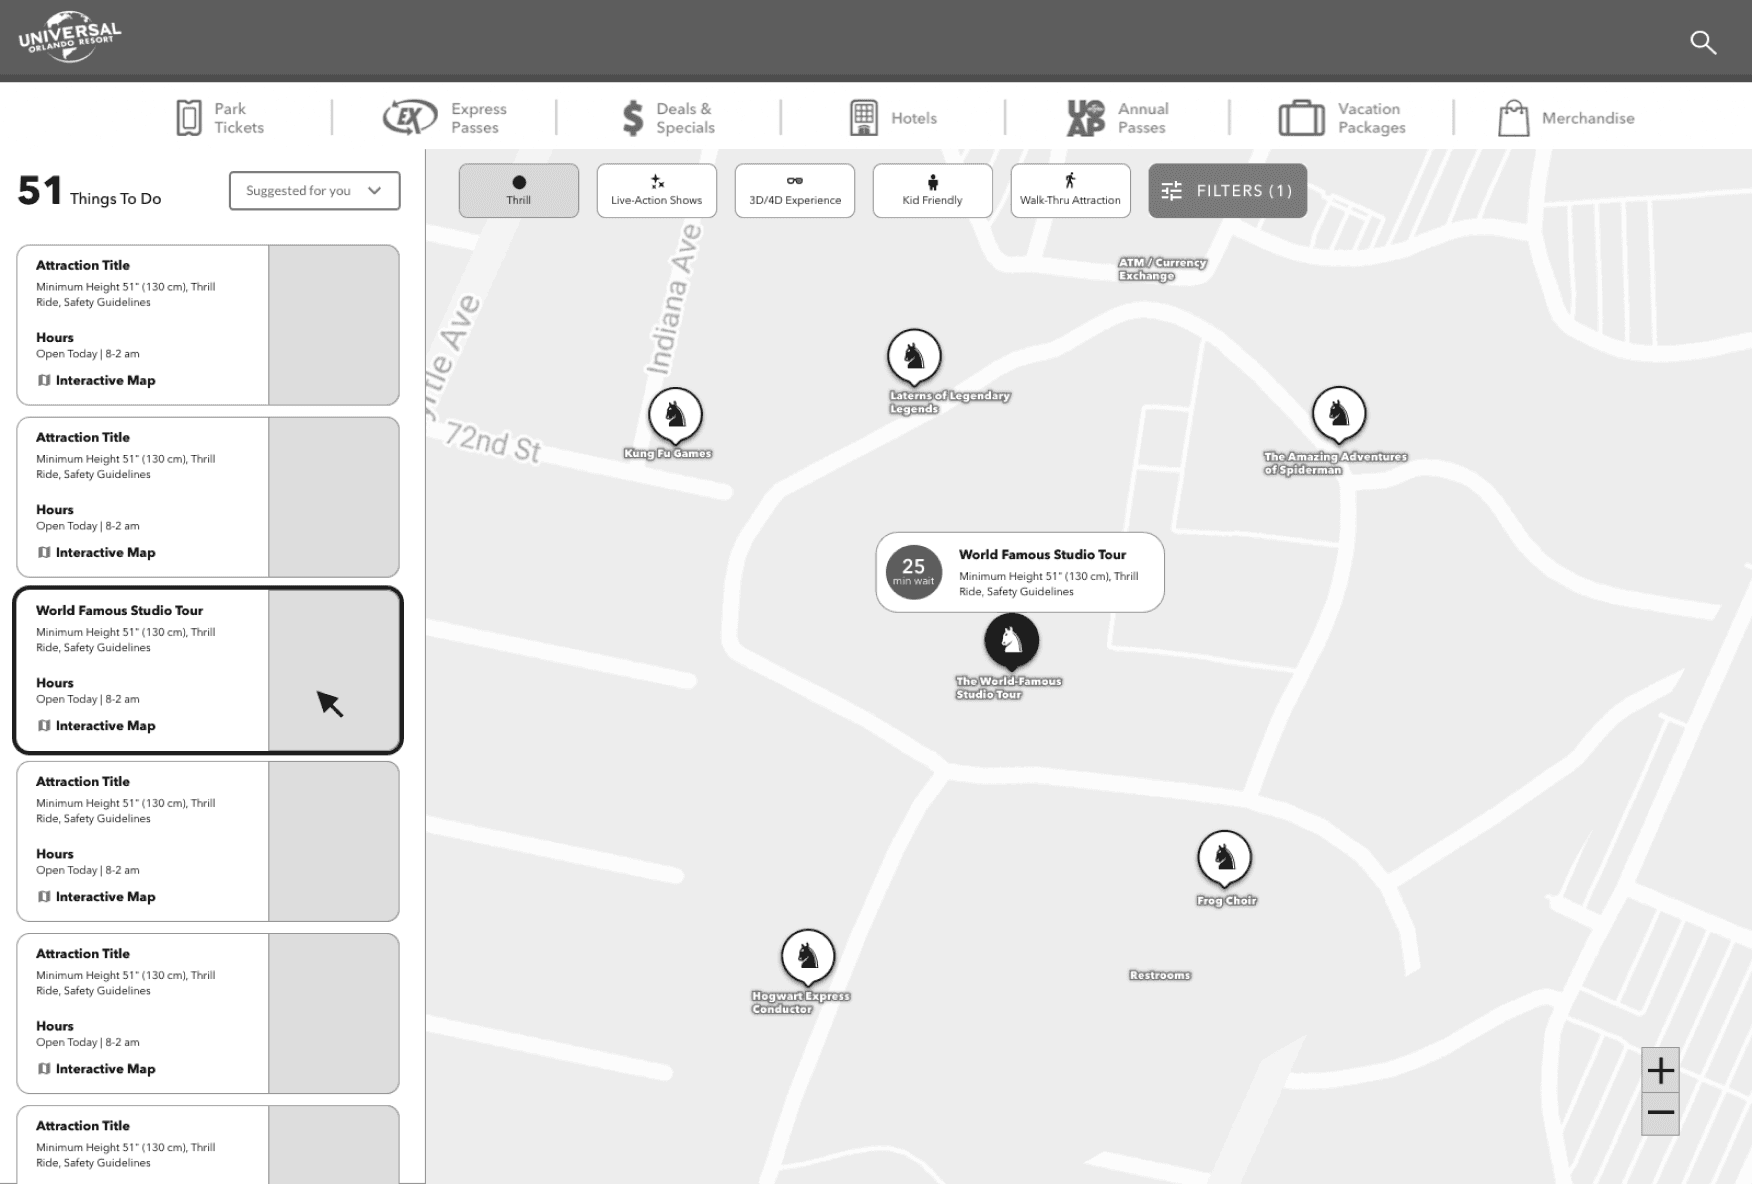
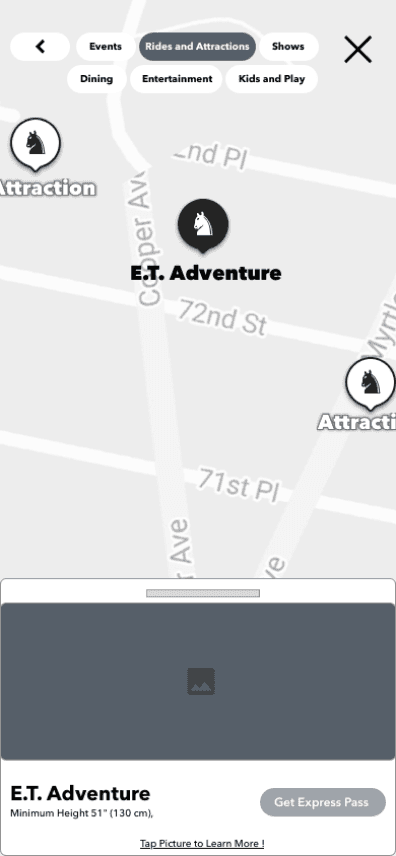
Above is the map before my work in the re-design. I led a comprehensive competitive analysis of interactive tools to gain deep insights into the design landscape.
Leveraging secondary research data from the Baymard Institute, I used their repository to research and evaluate competitor design successes and pain points.

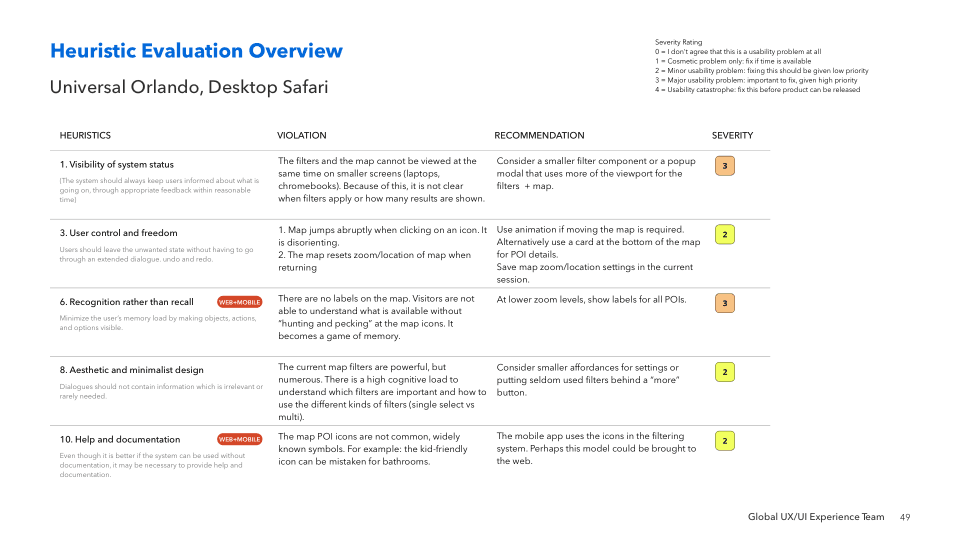
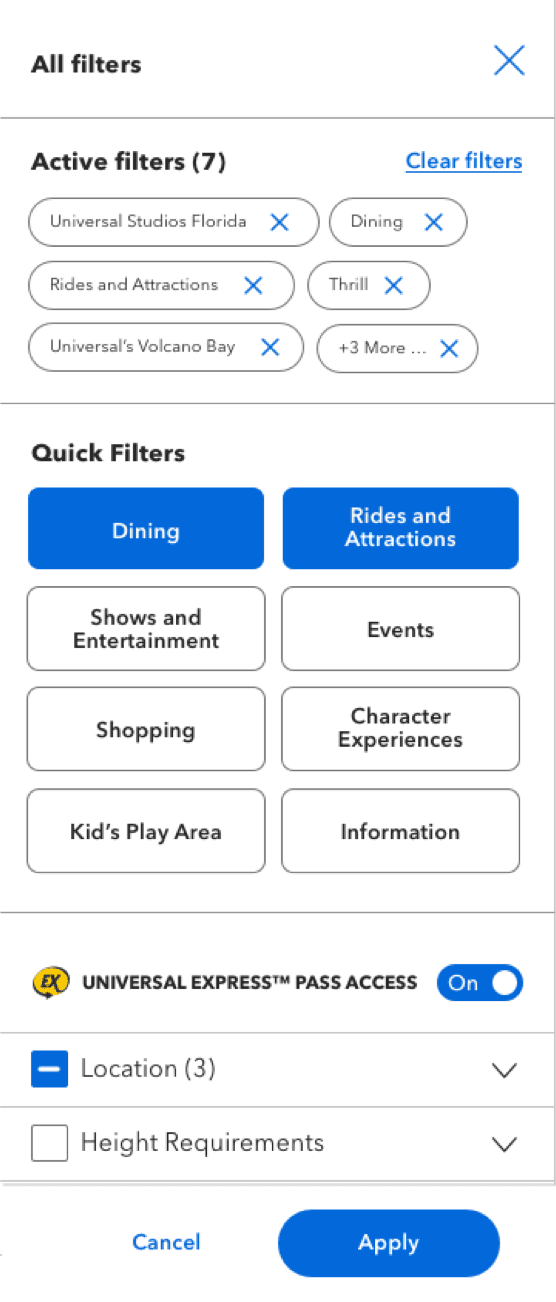
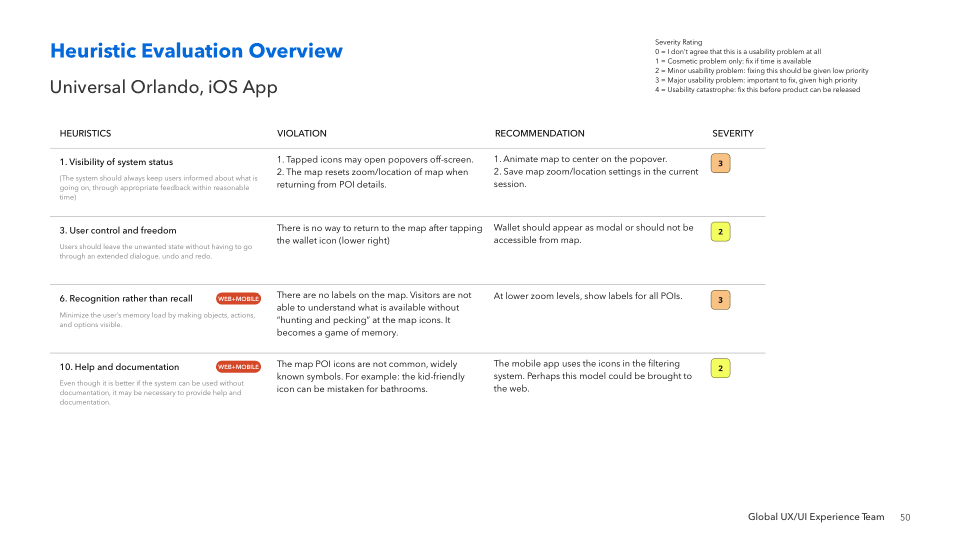
This effort resulted in a Heuristic Evaluation guide that I used to communicate planned changes to the product and development teams.
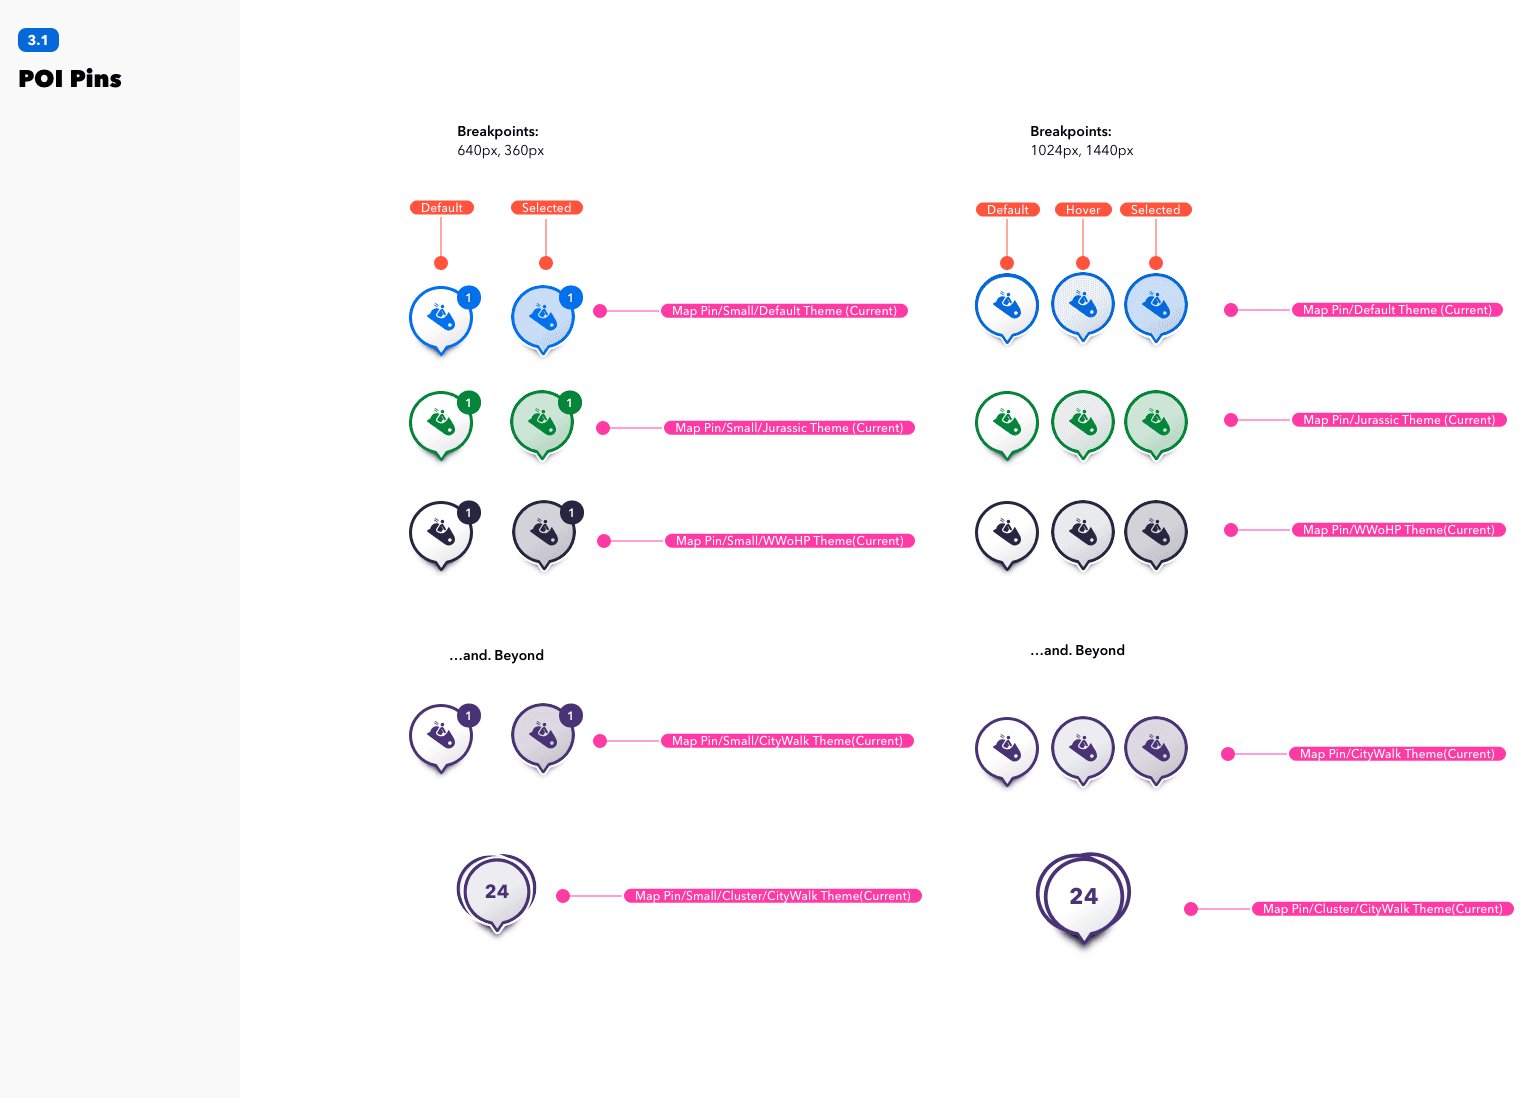
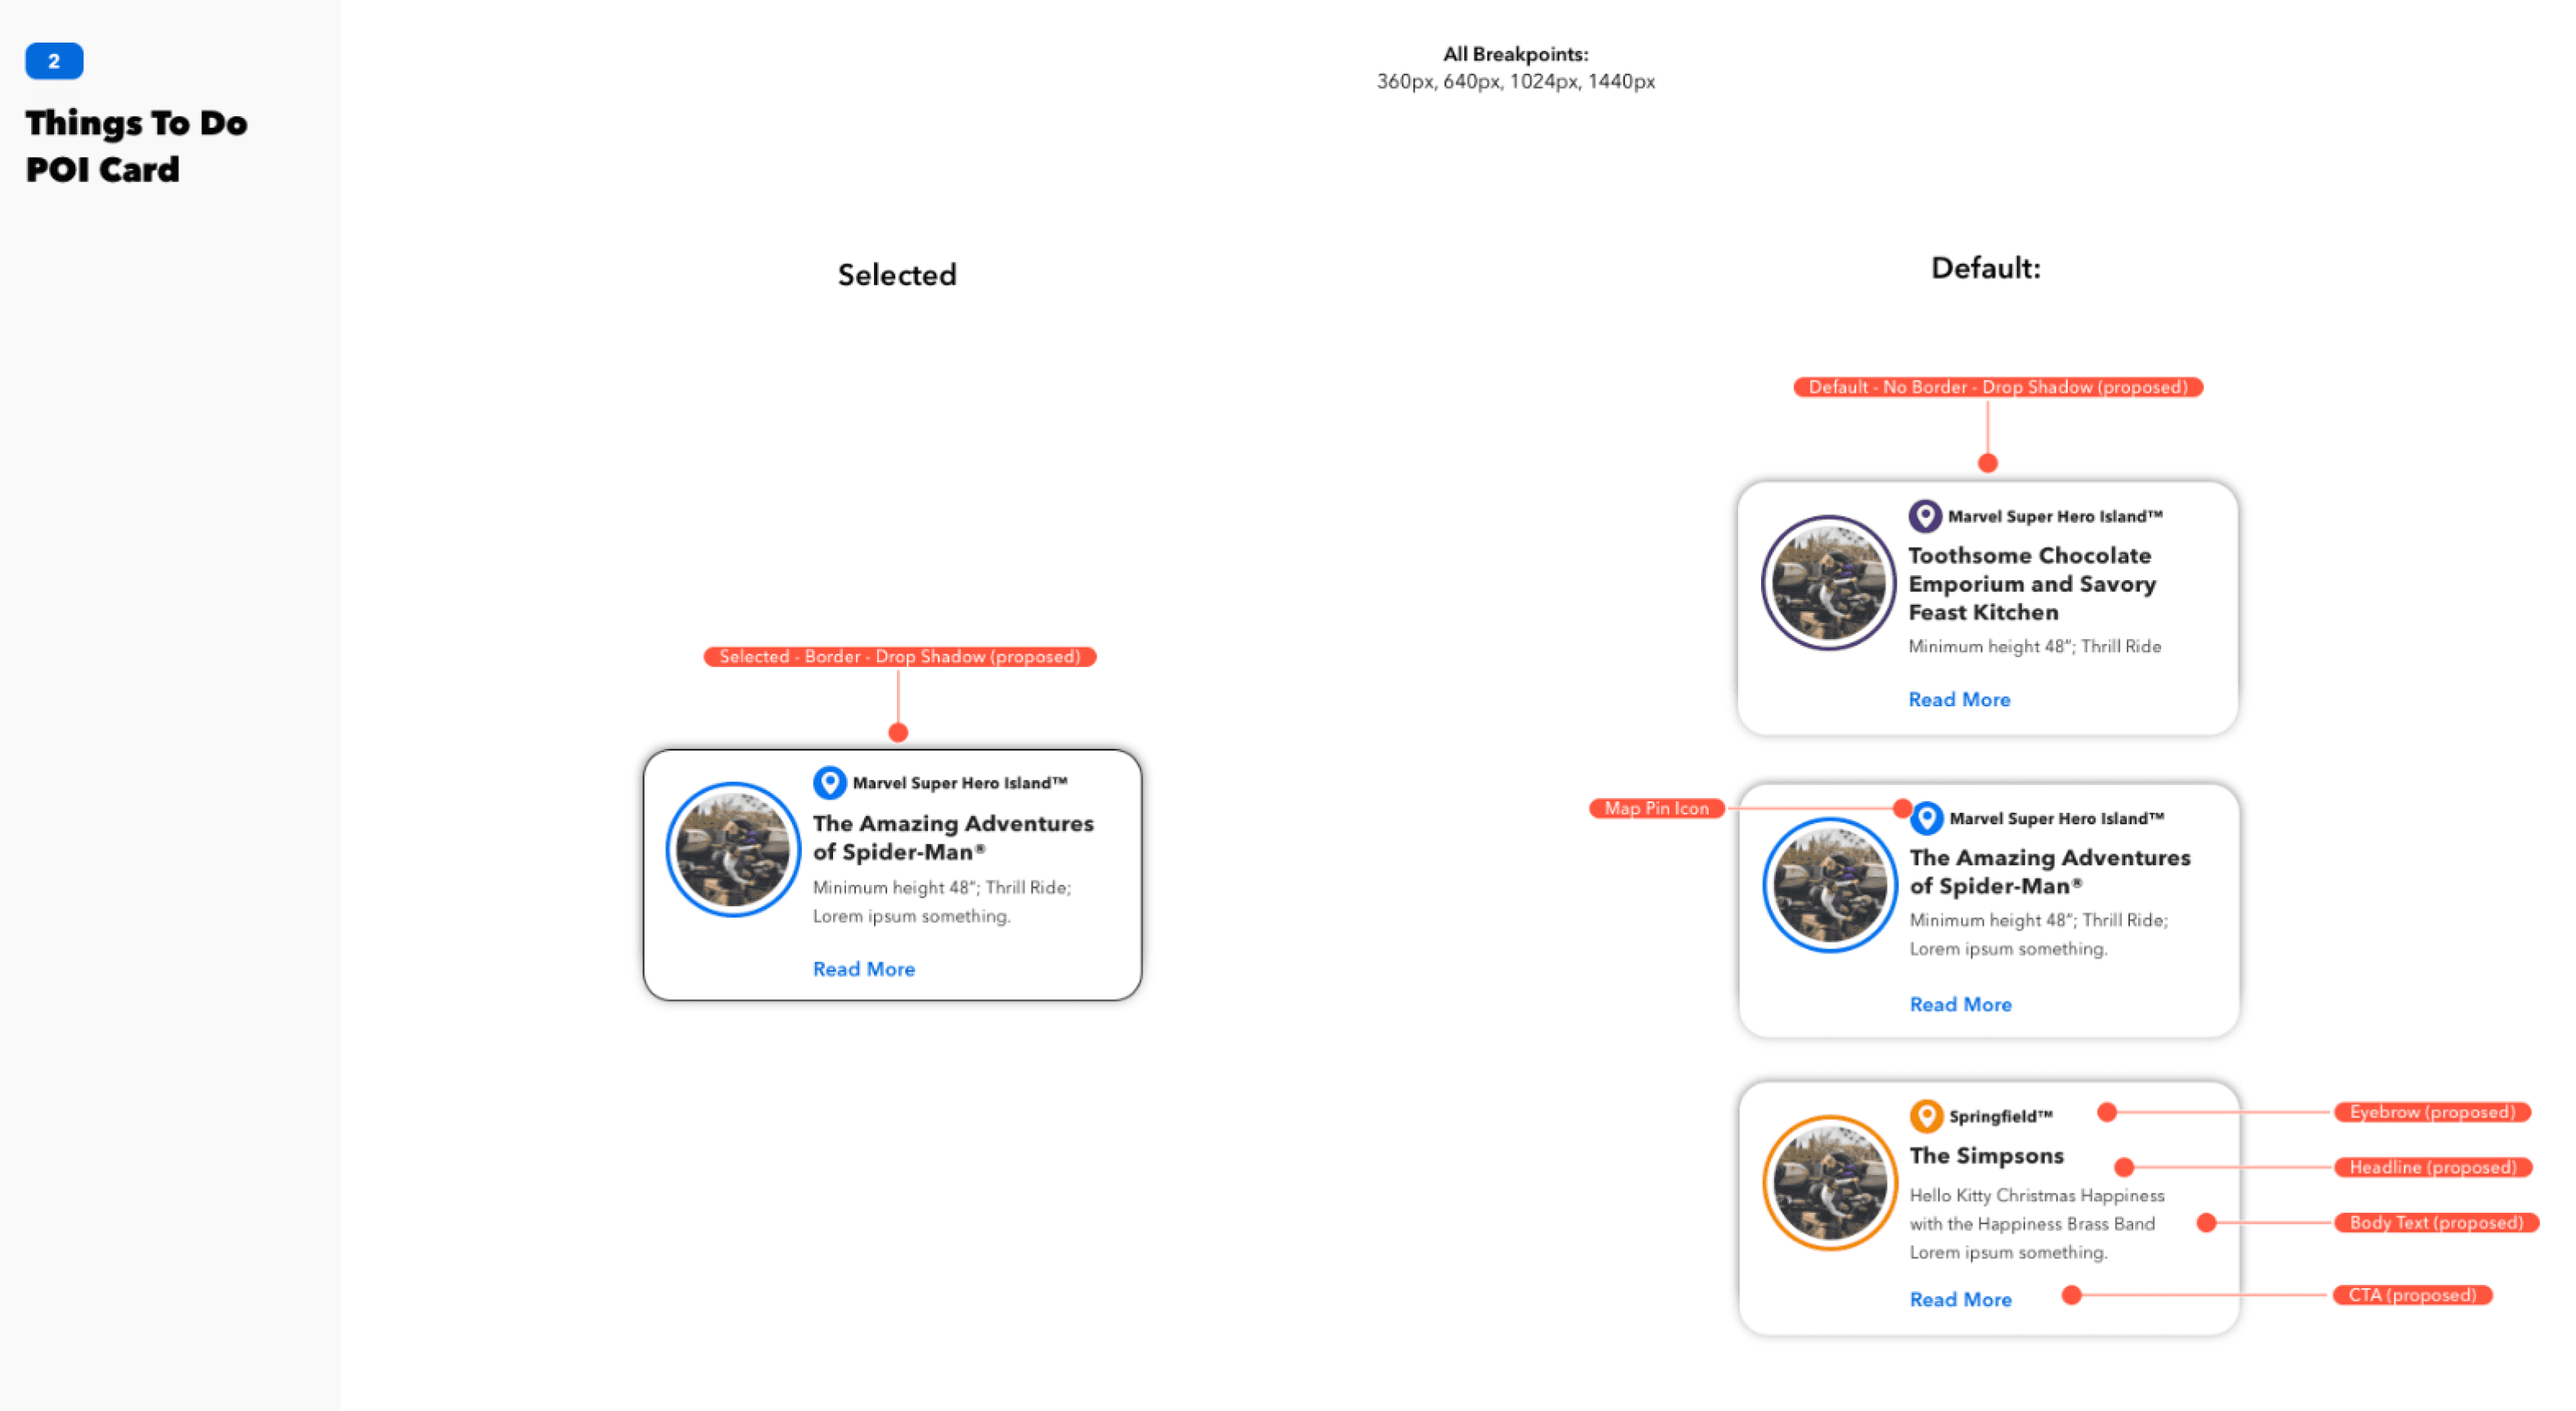
Heuristic Evaluation Points
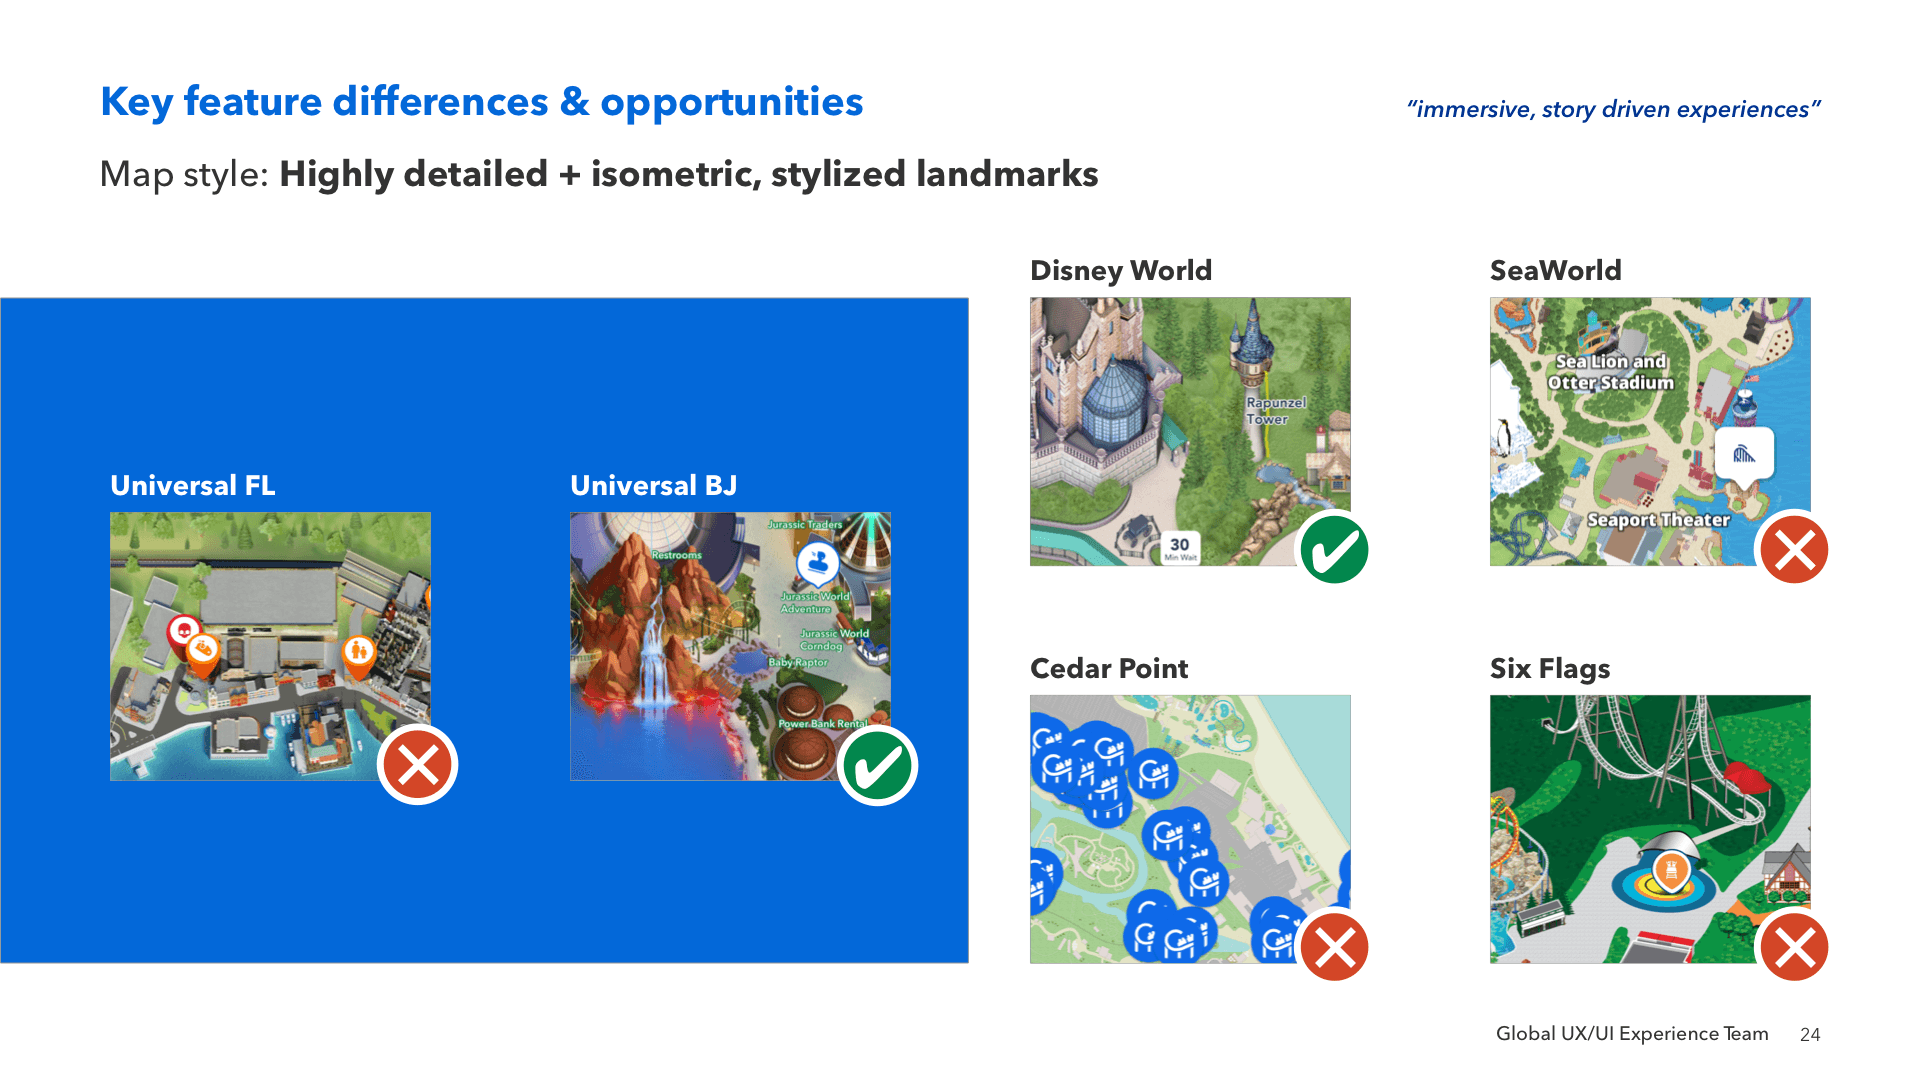
Competitive Analysis - Design Opportunities:
Identified clear signifiers that grab attention and effectively communicate usage.
Analyzed the hierarchy and placement of search tools to enhance the visibility and usability of the interactive map.
Improved the clarity of in-park jargon and established information architecture patterns for Points of Interest (POIs).
Communicated the necessity of testing various interaction patterns during the design phase.
I used this research to not only assess the current state of the tools but also to outline my vision for enhancing design patterns and improving guest accessibility moving forward.
Low-fidelity Ideation
I spearheaded the initial ideation phase once the team reached a consensus on project objectives.
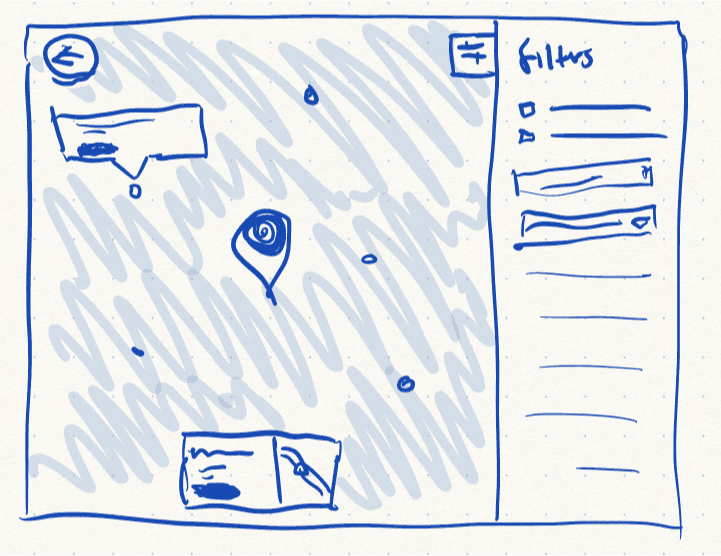
I used Mind Mapping and Rapid Ideation techniques to generate a diverse array of ideas, followed by a SWOT analysis to streamline options.
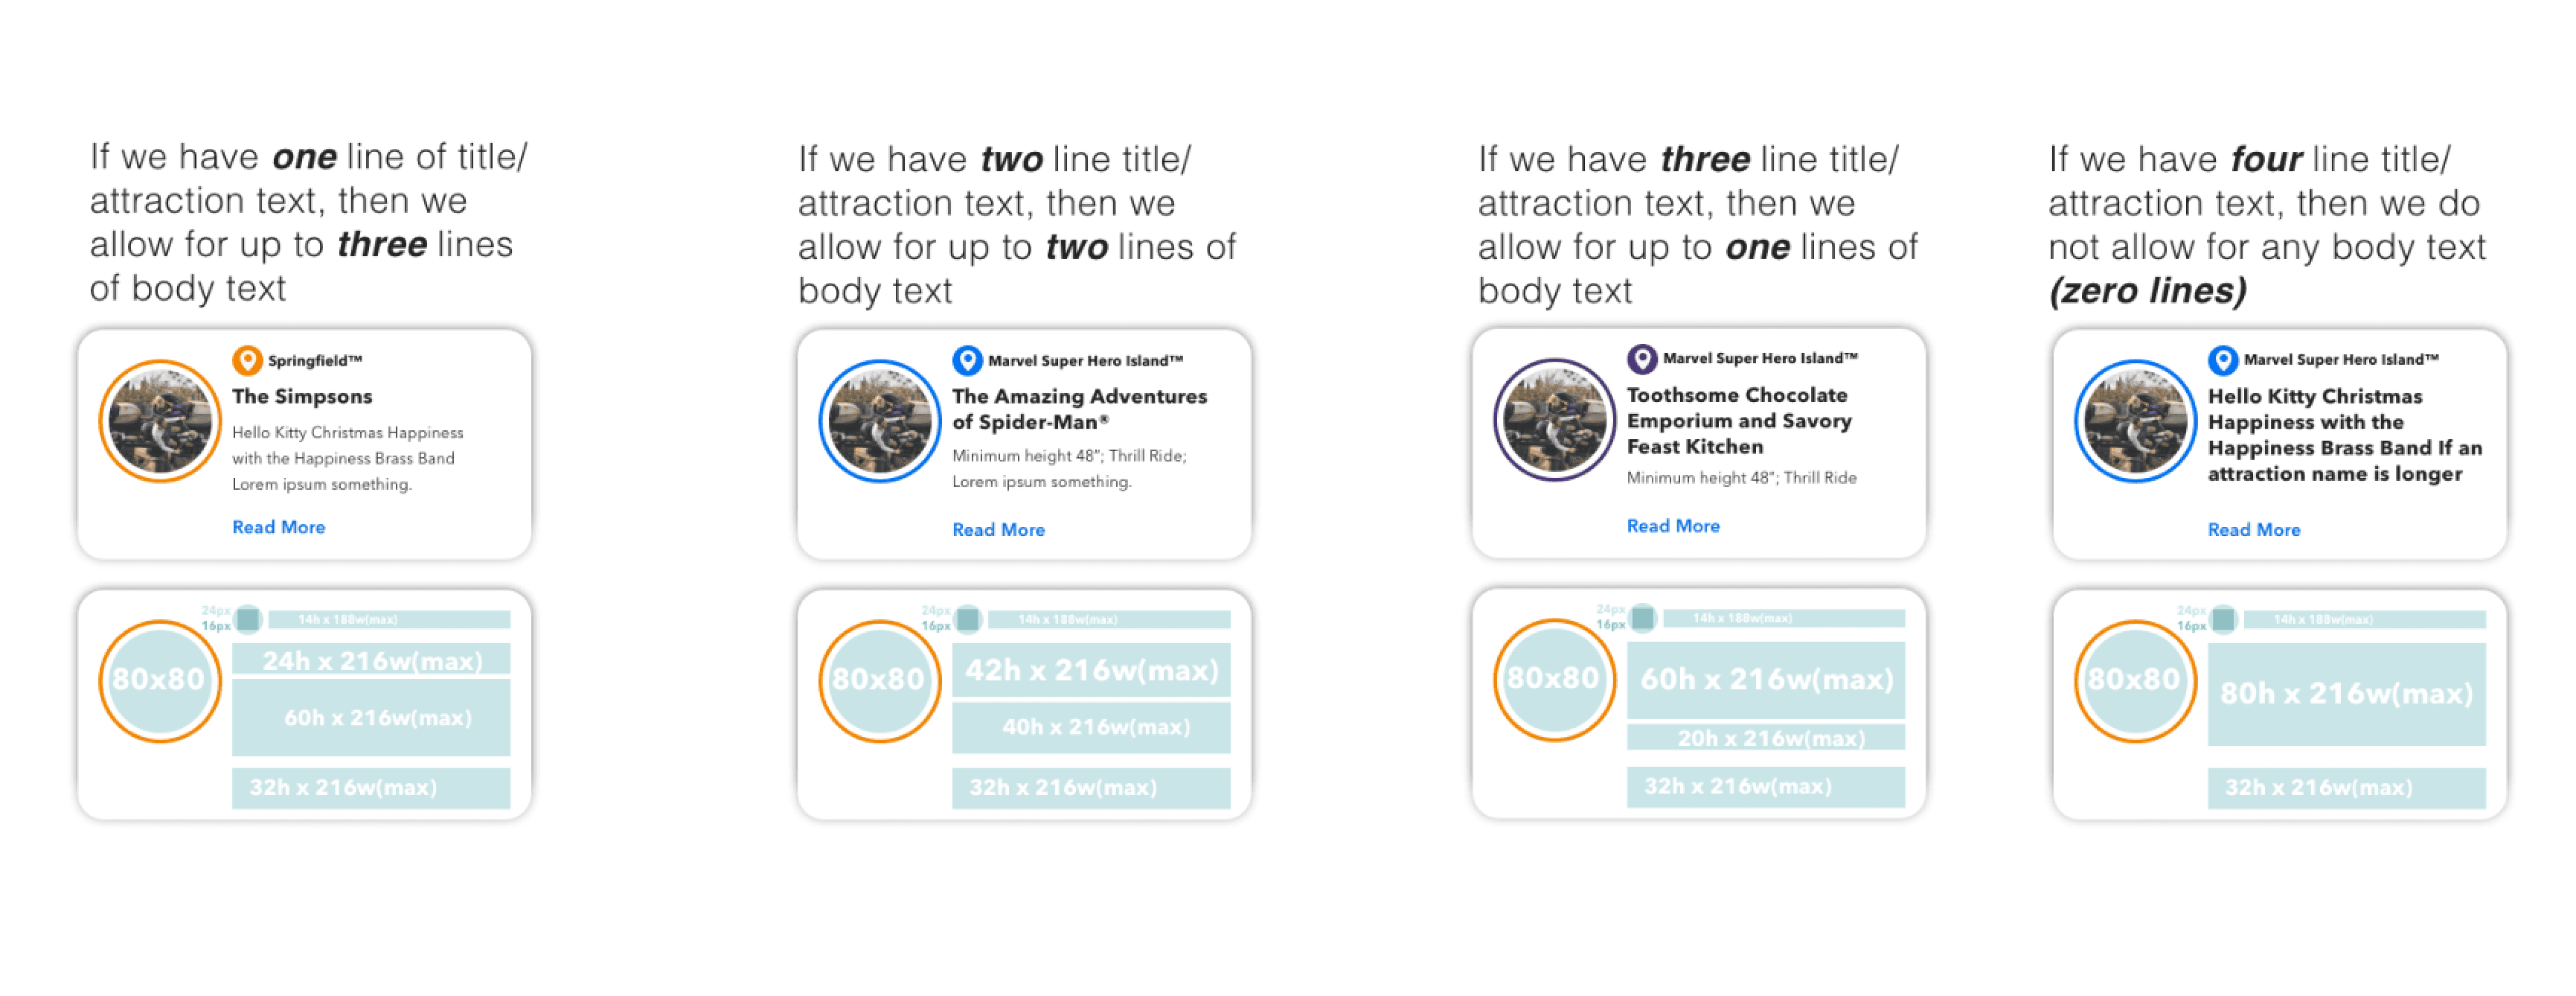
I identified two primary patterns for the interactive map's structure and developed low-fi models from there:
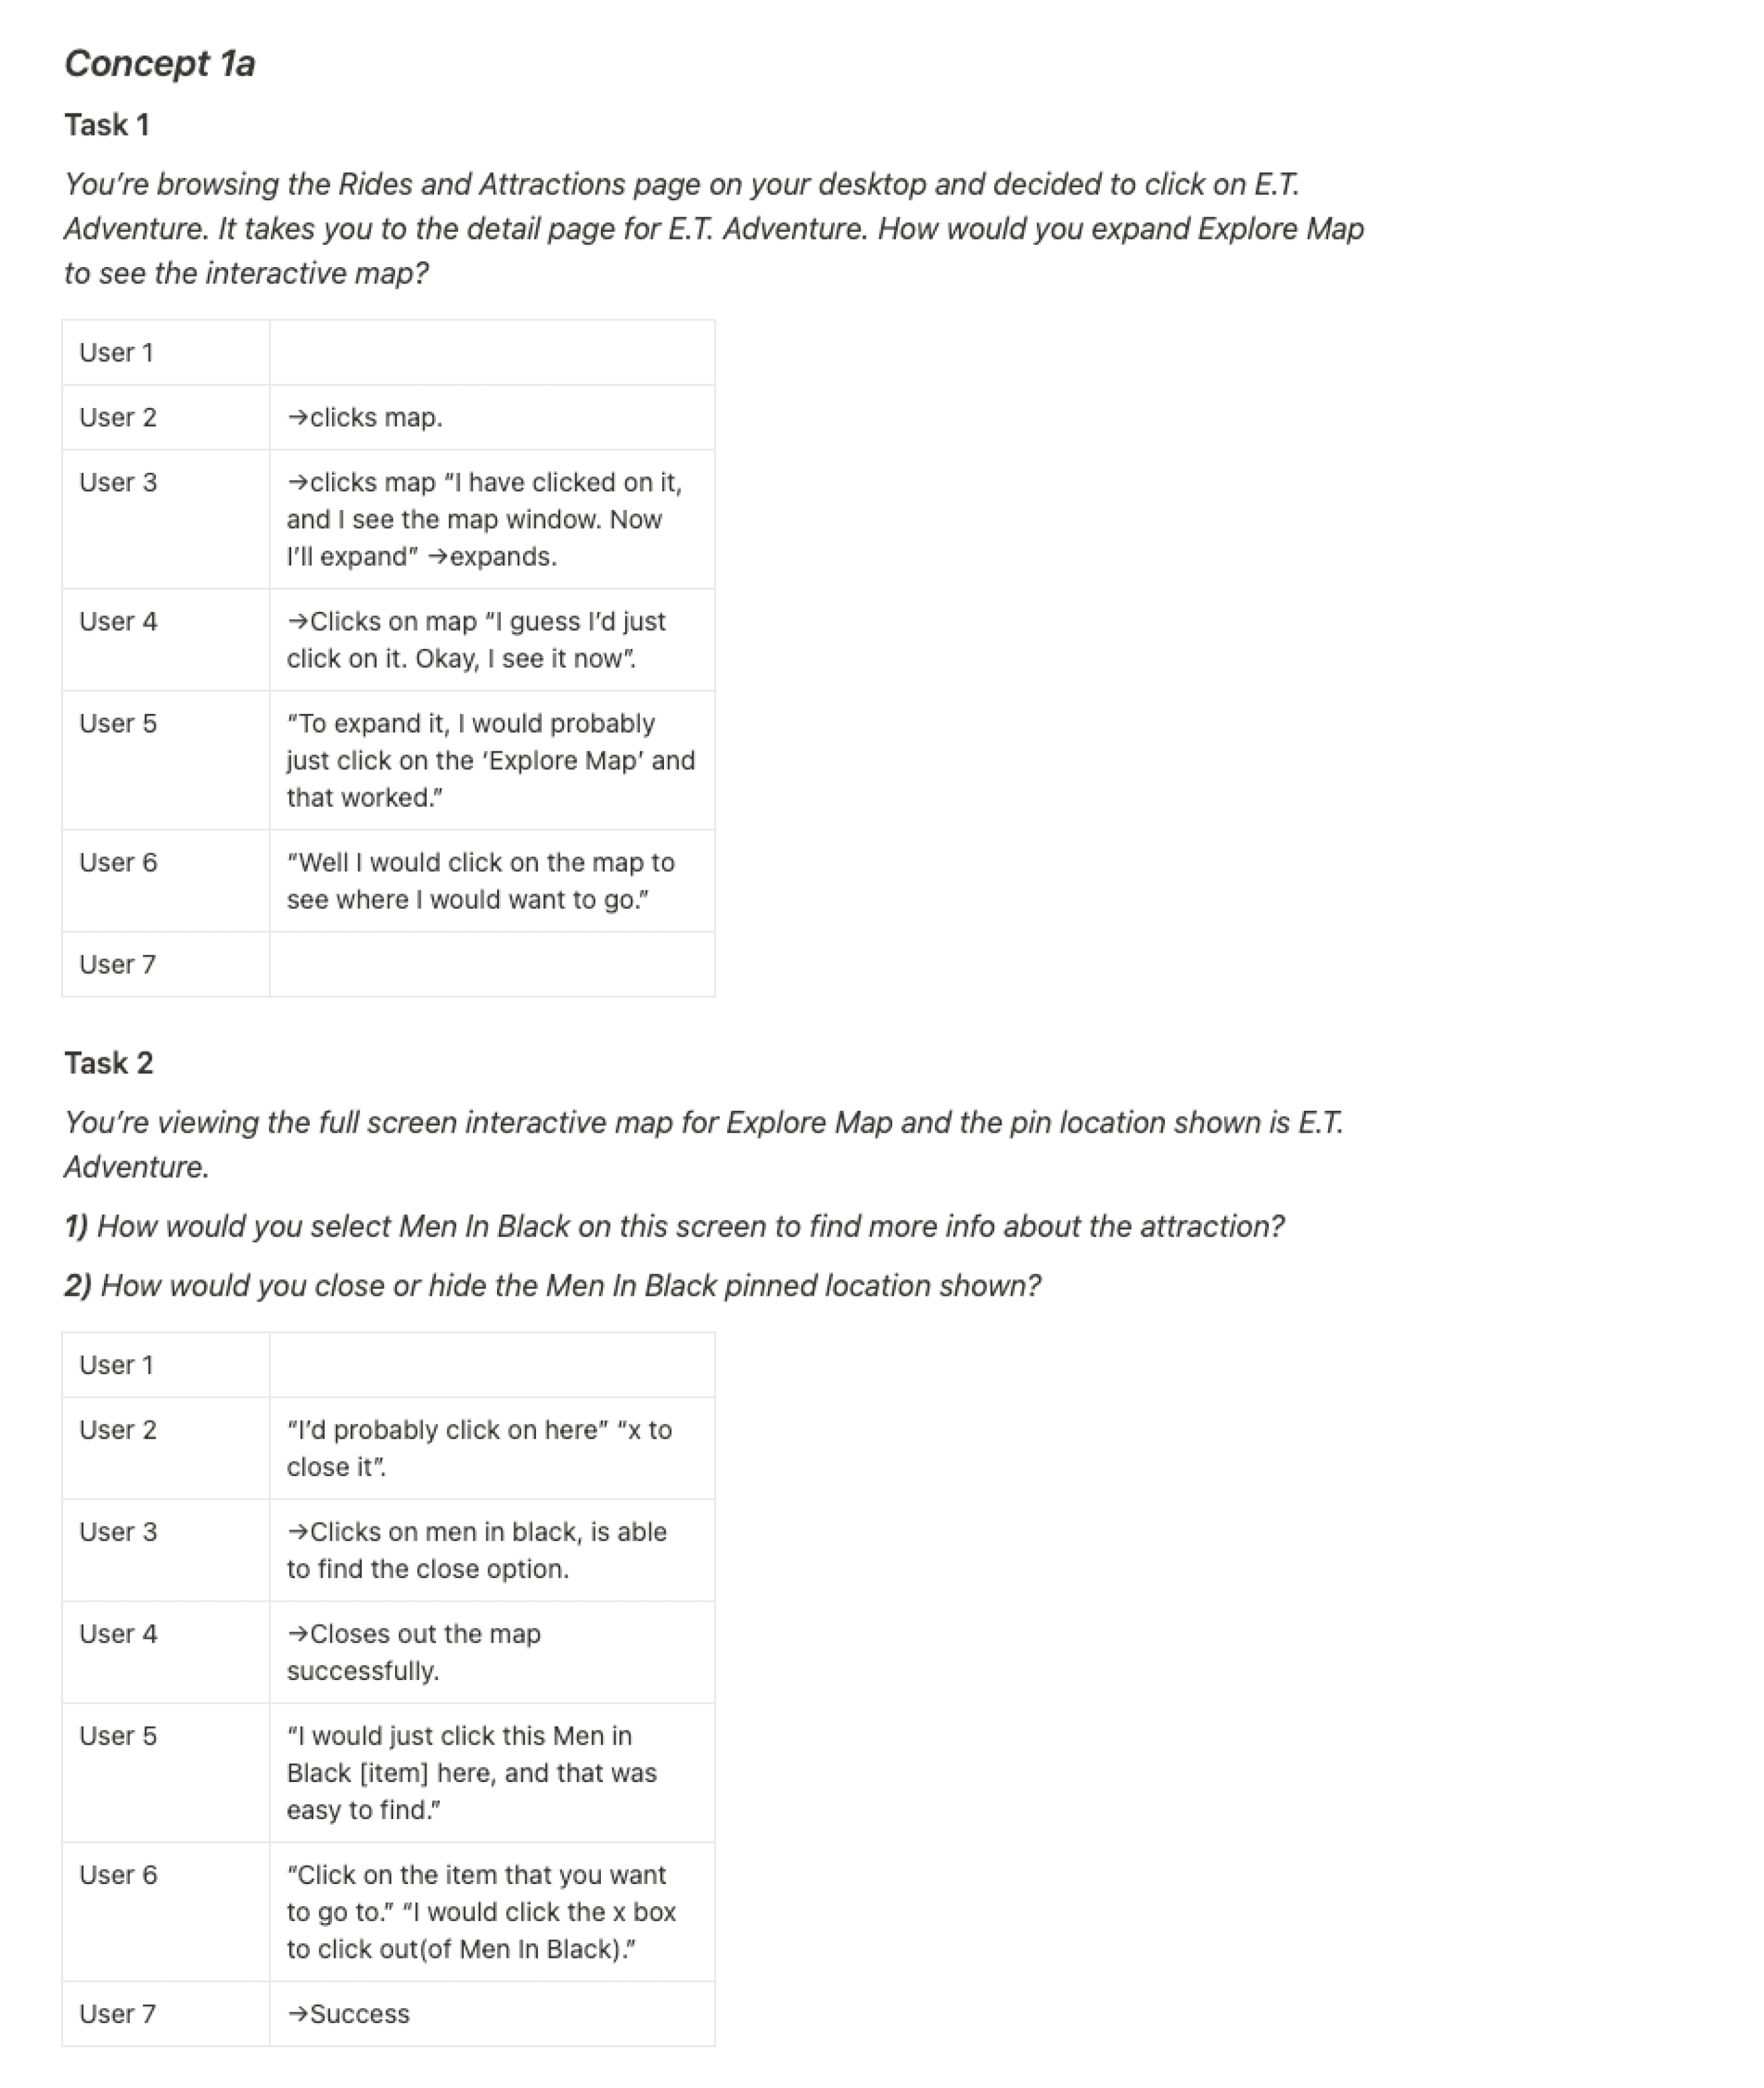
• After further refinement, I presented three design concepts (1a, 1b, and 2) to the team.
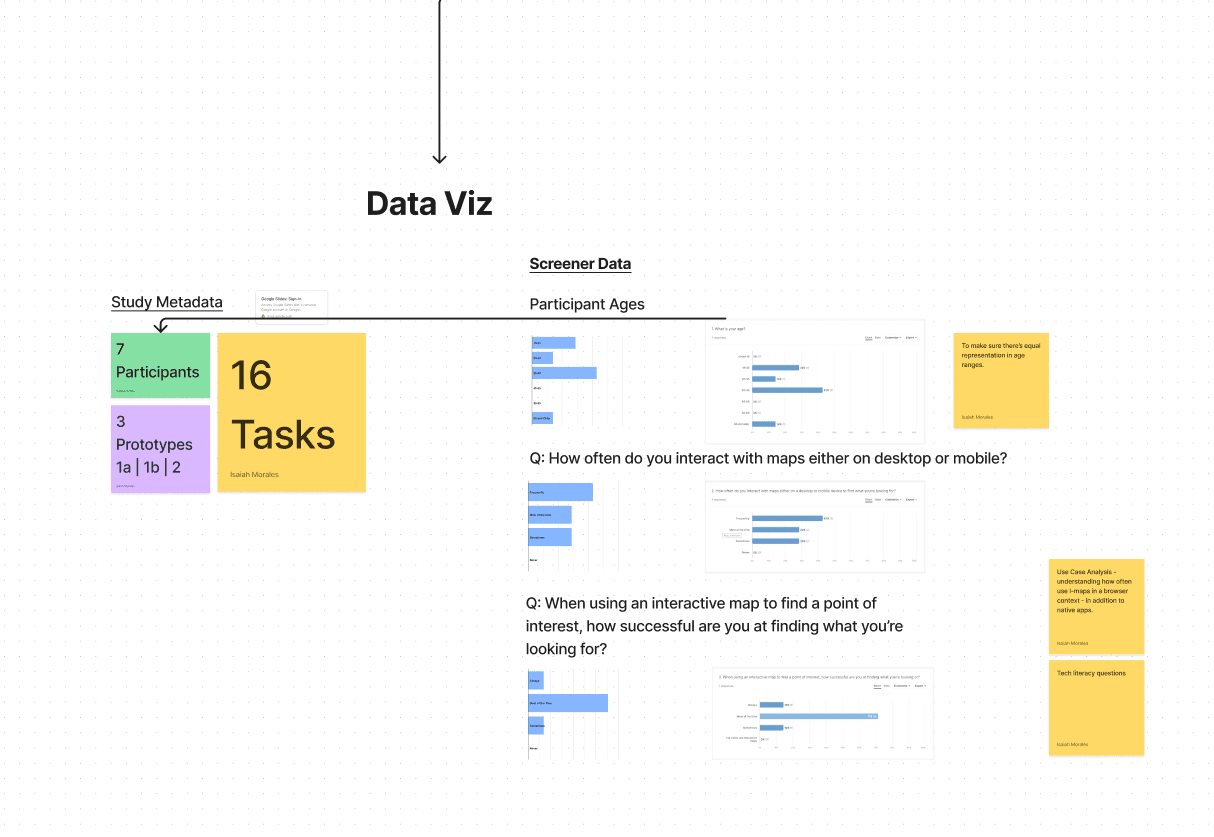
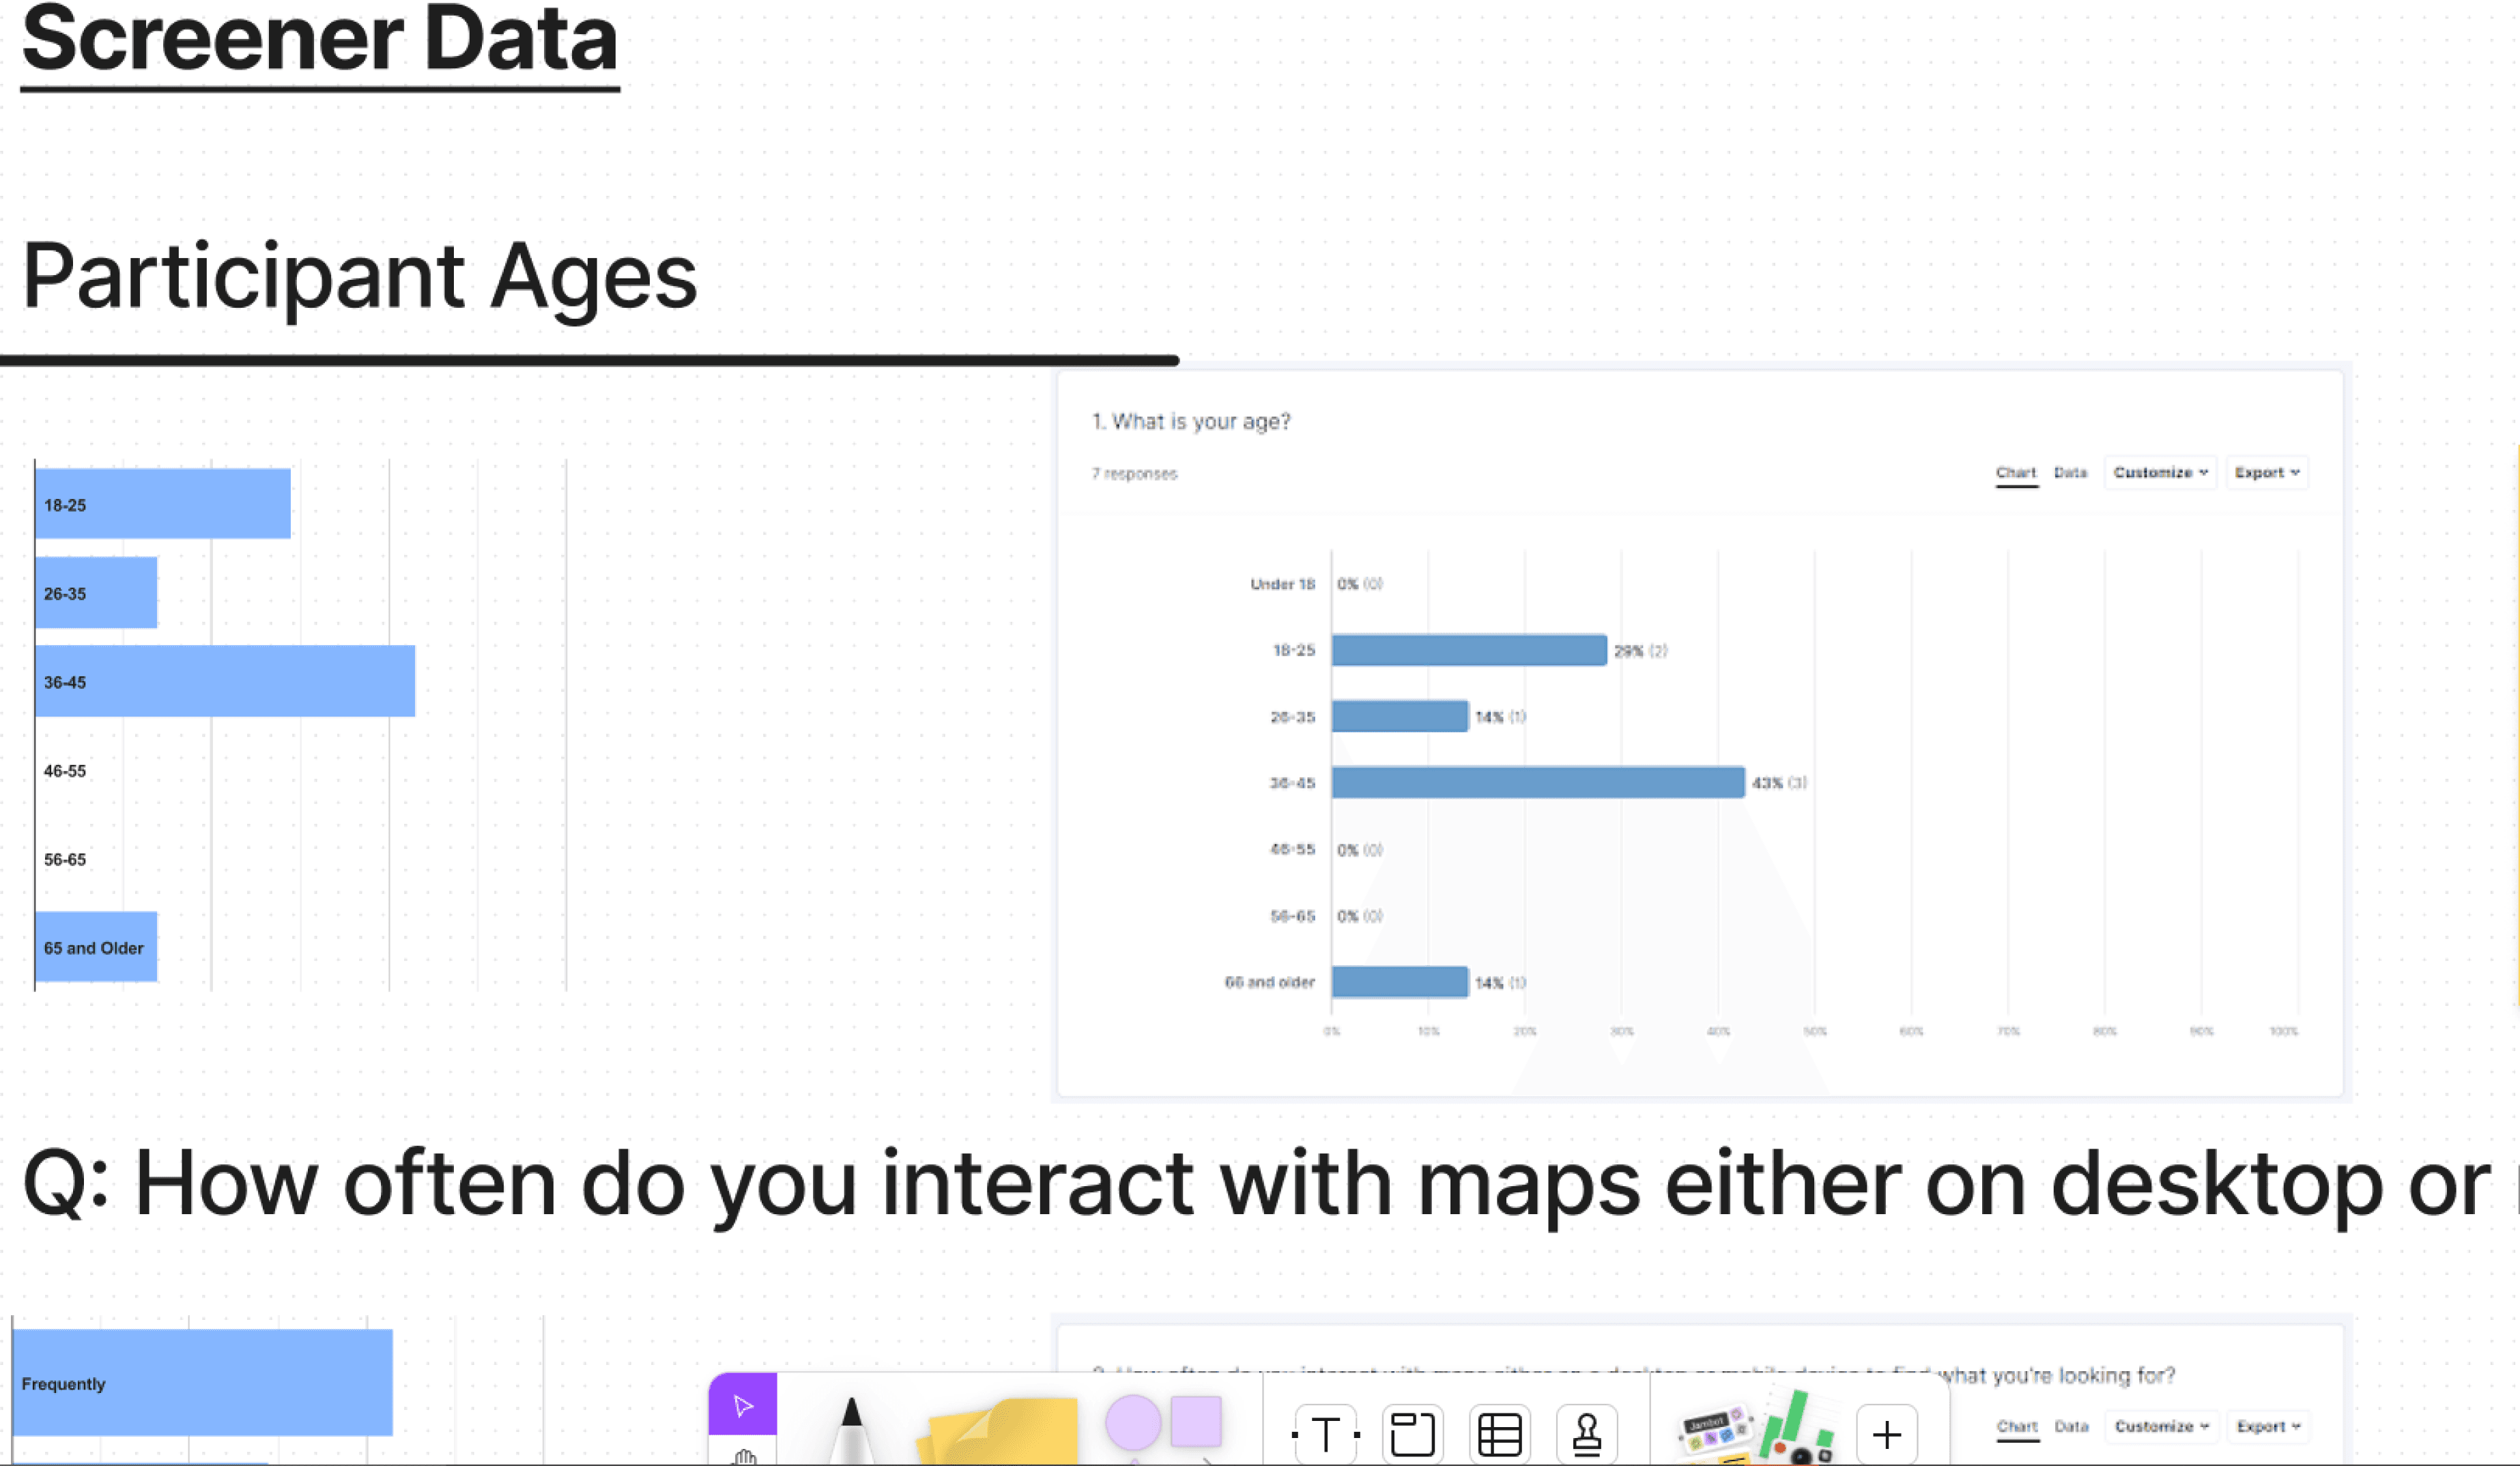
• The goal for primary research: test two distinct approaches to building the interactive map.
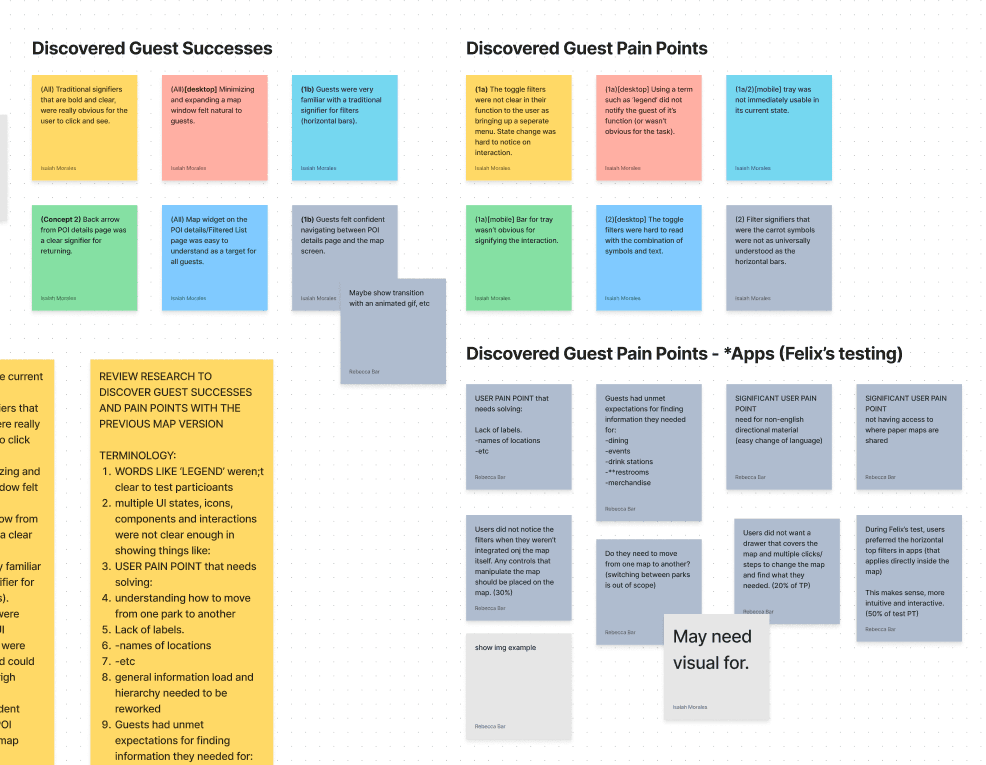
I coded data for each wireframe prototype, noting the pros and cons as the product team approved the concepts for testing.
Collaborating with my design partner, Rebecca Bar, and our partners at Dojo, we presented our data.
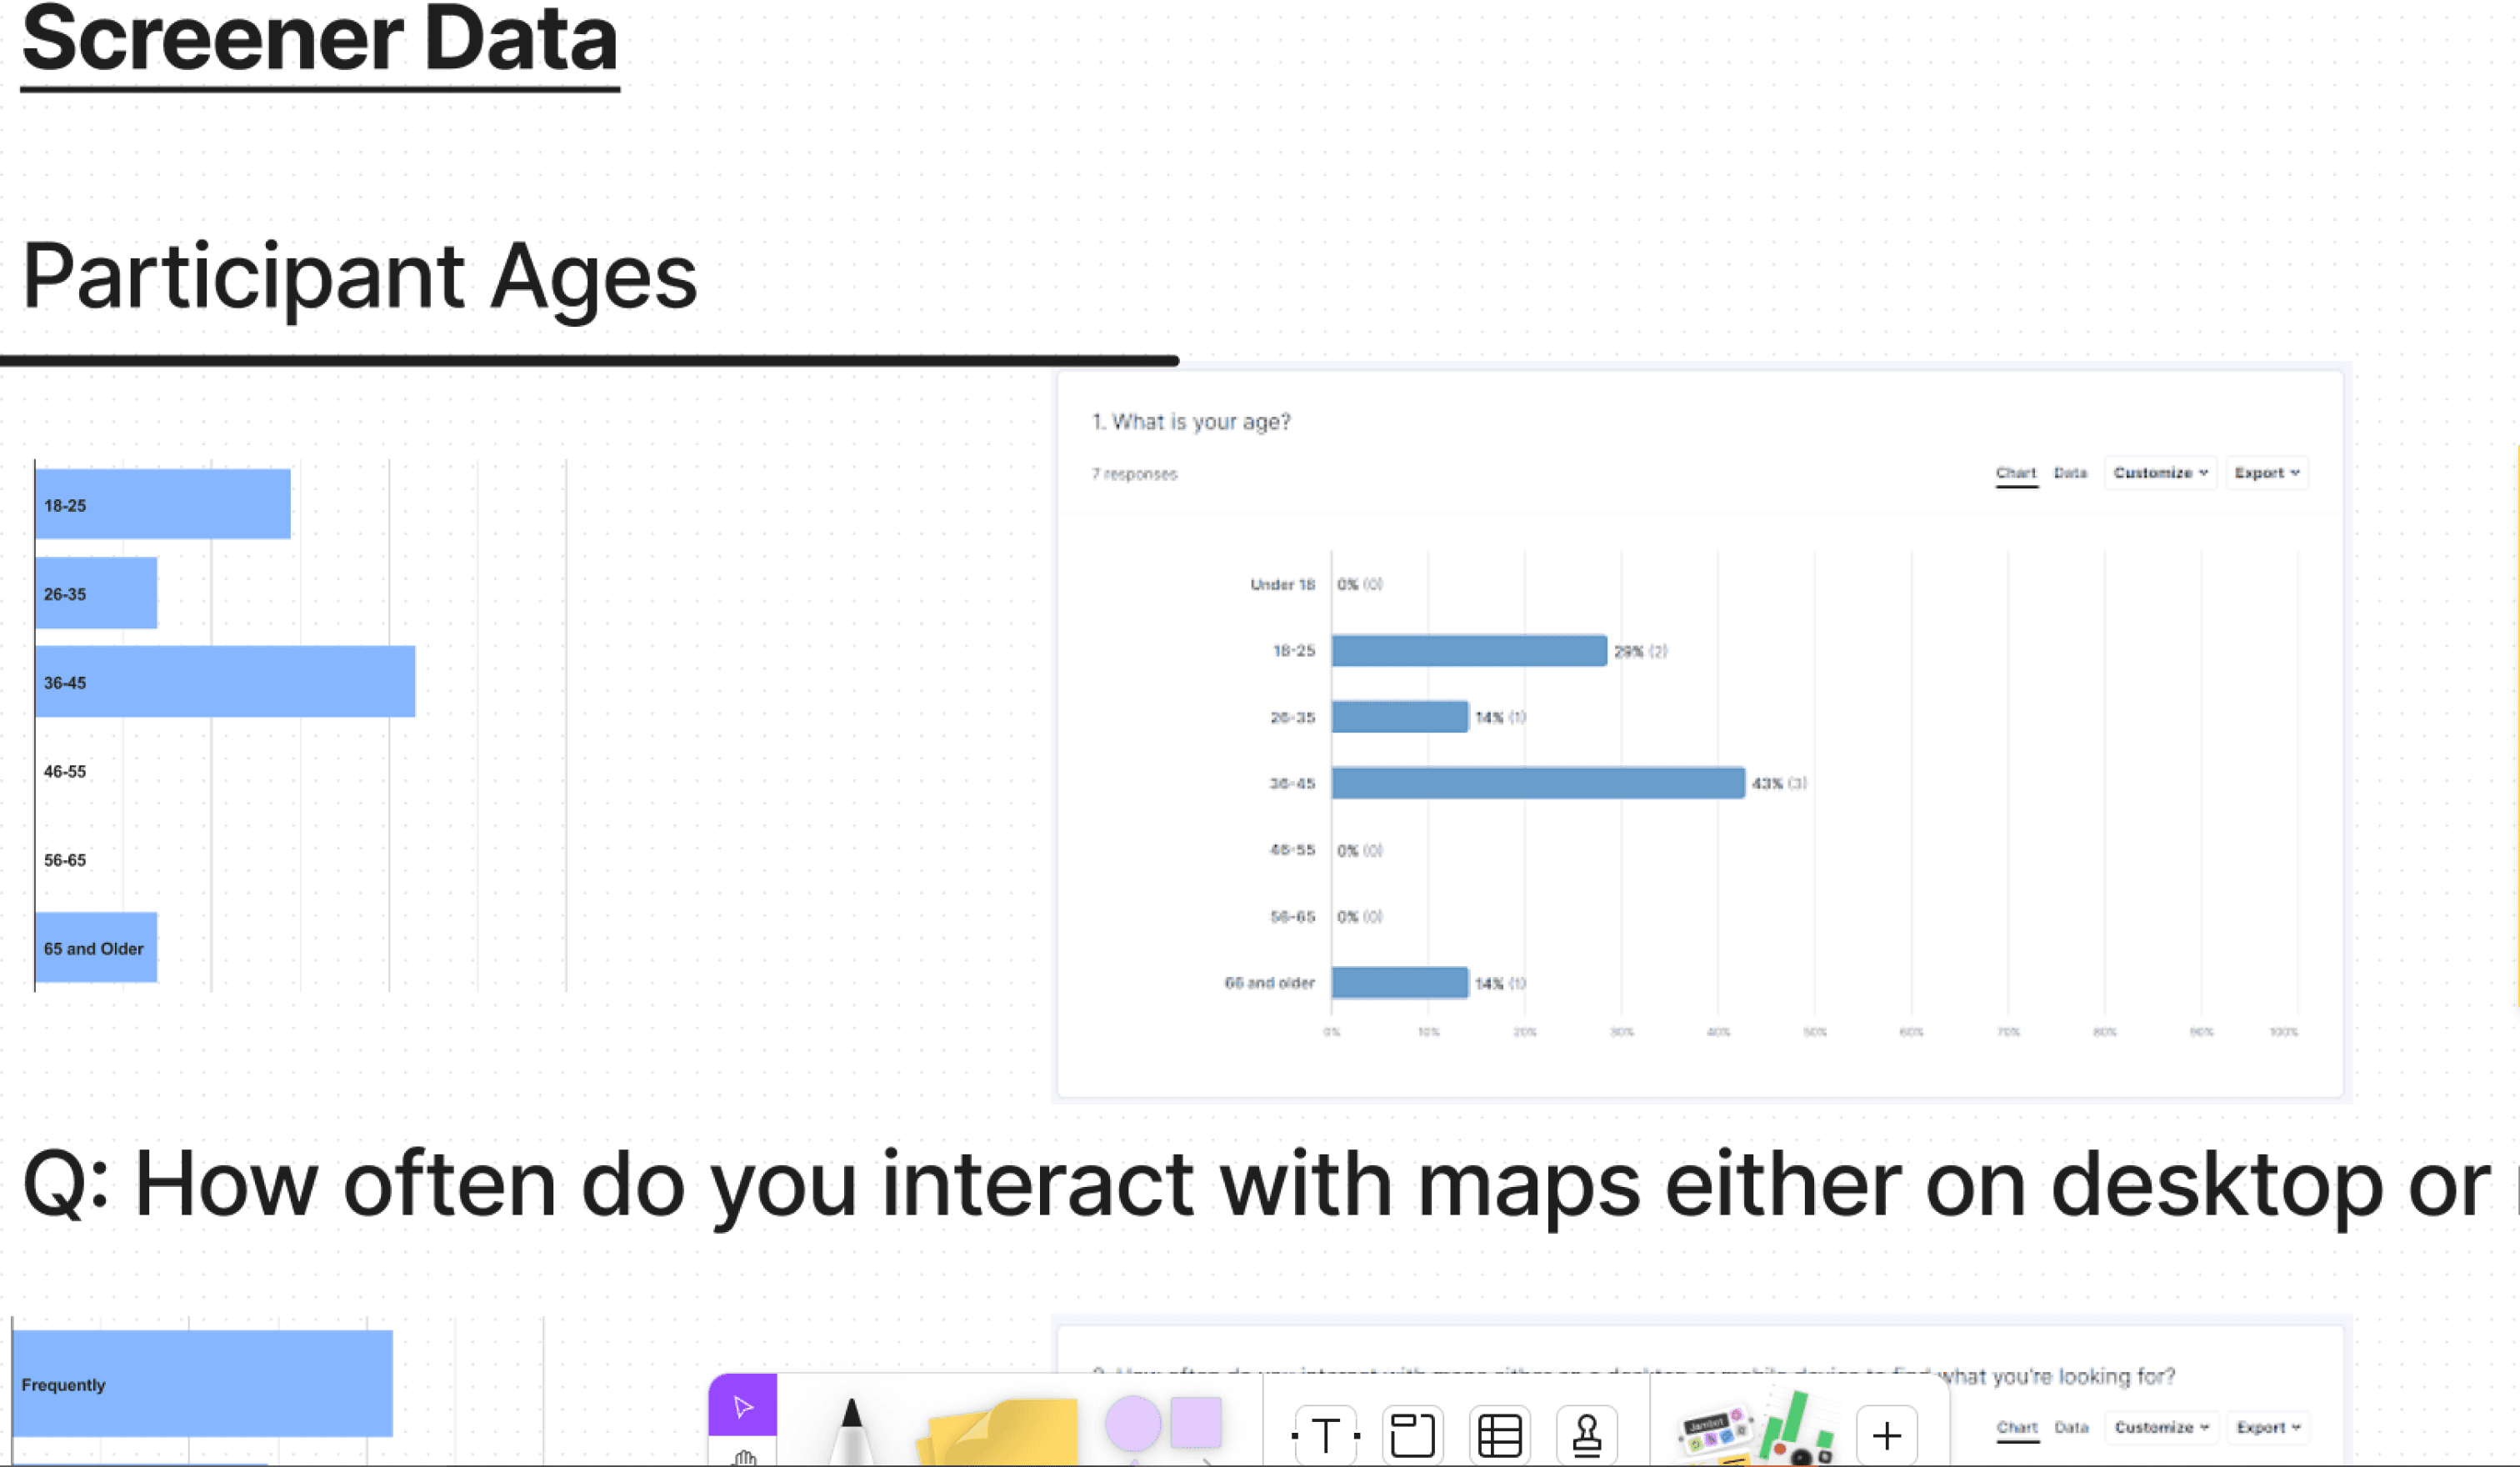
The research was conducted online with a group of anonymous volunteers.

Design Principles
Visibility of System Status.

H1
Recognition rather than recall.

H6
User Control and Freedom.

H3
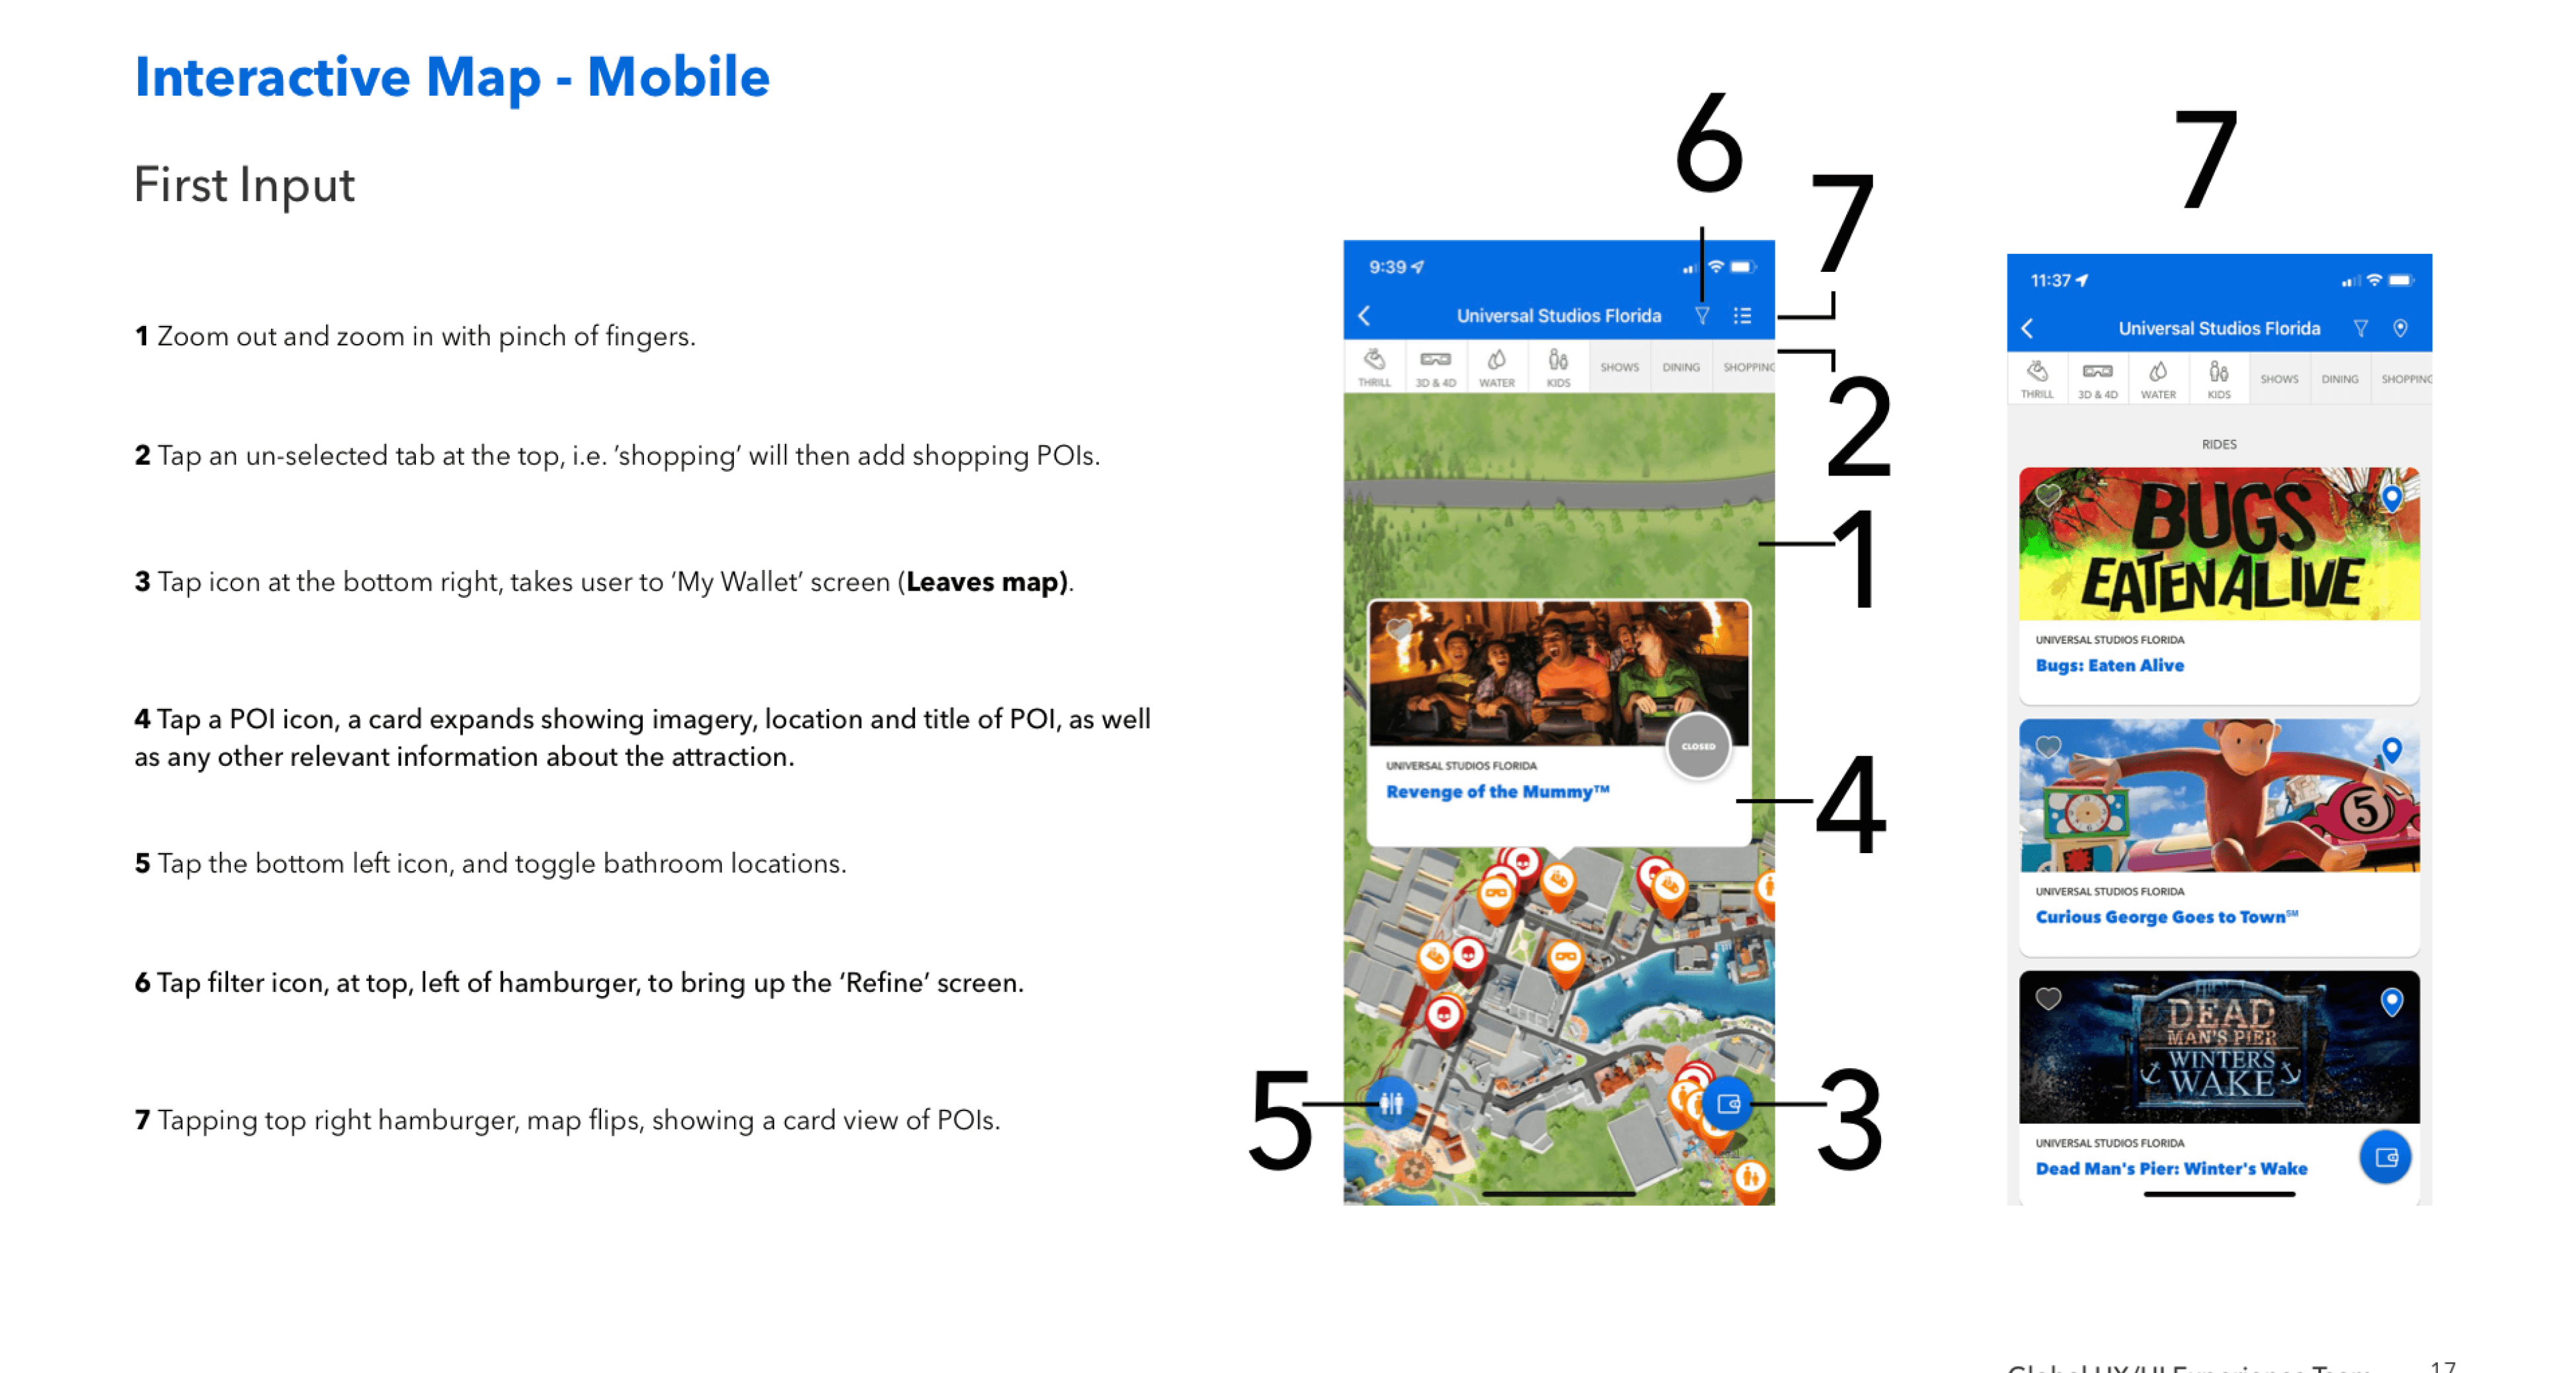
High-fidelity Ideation
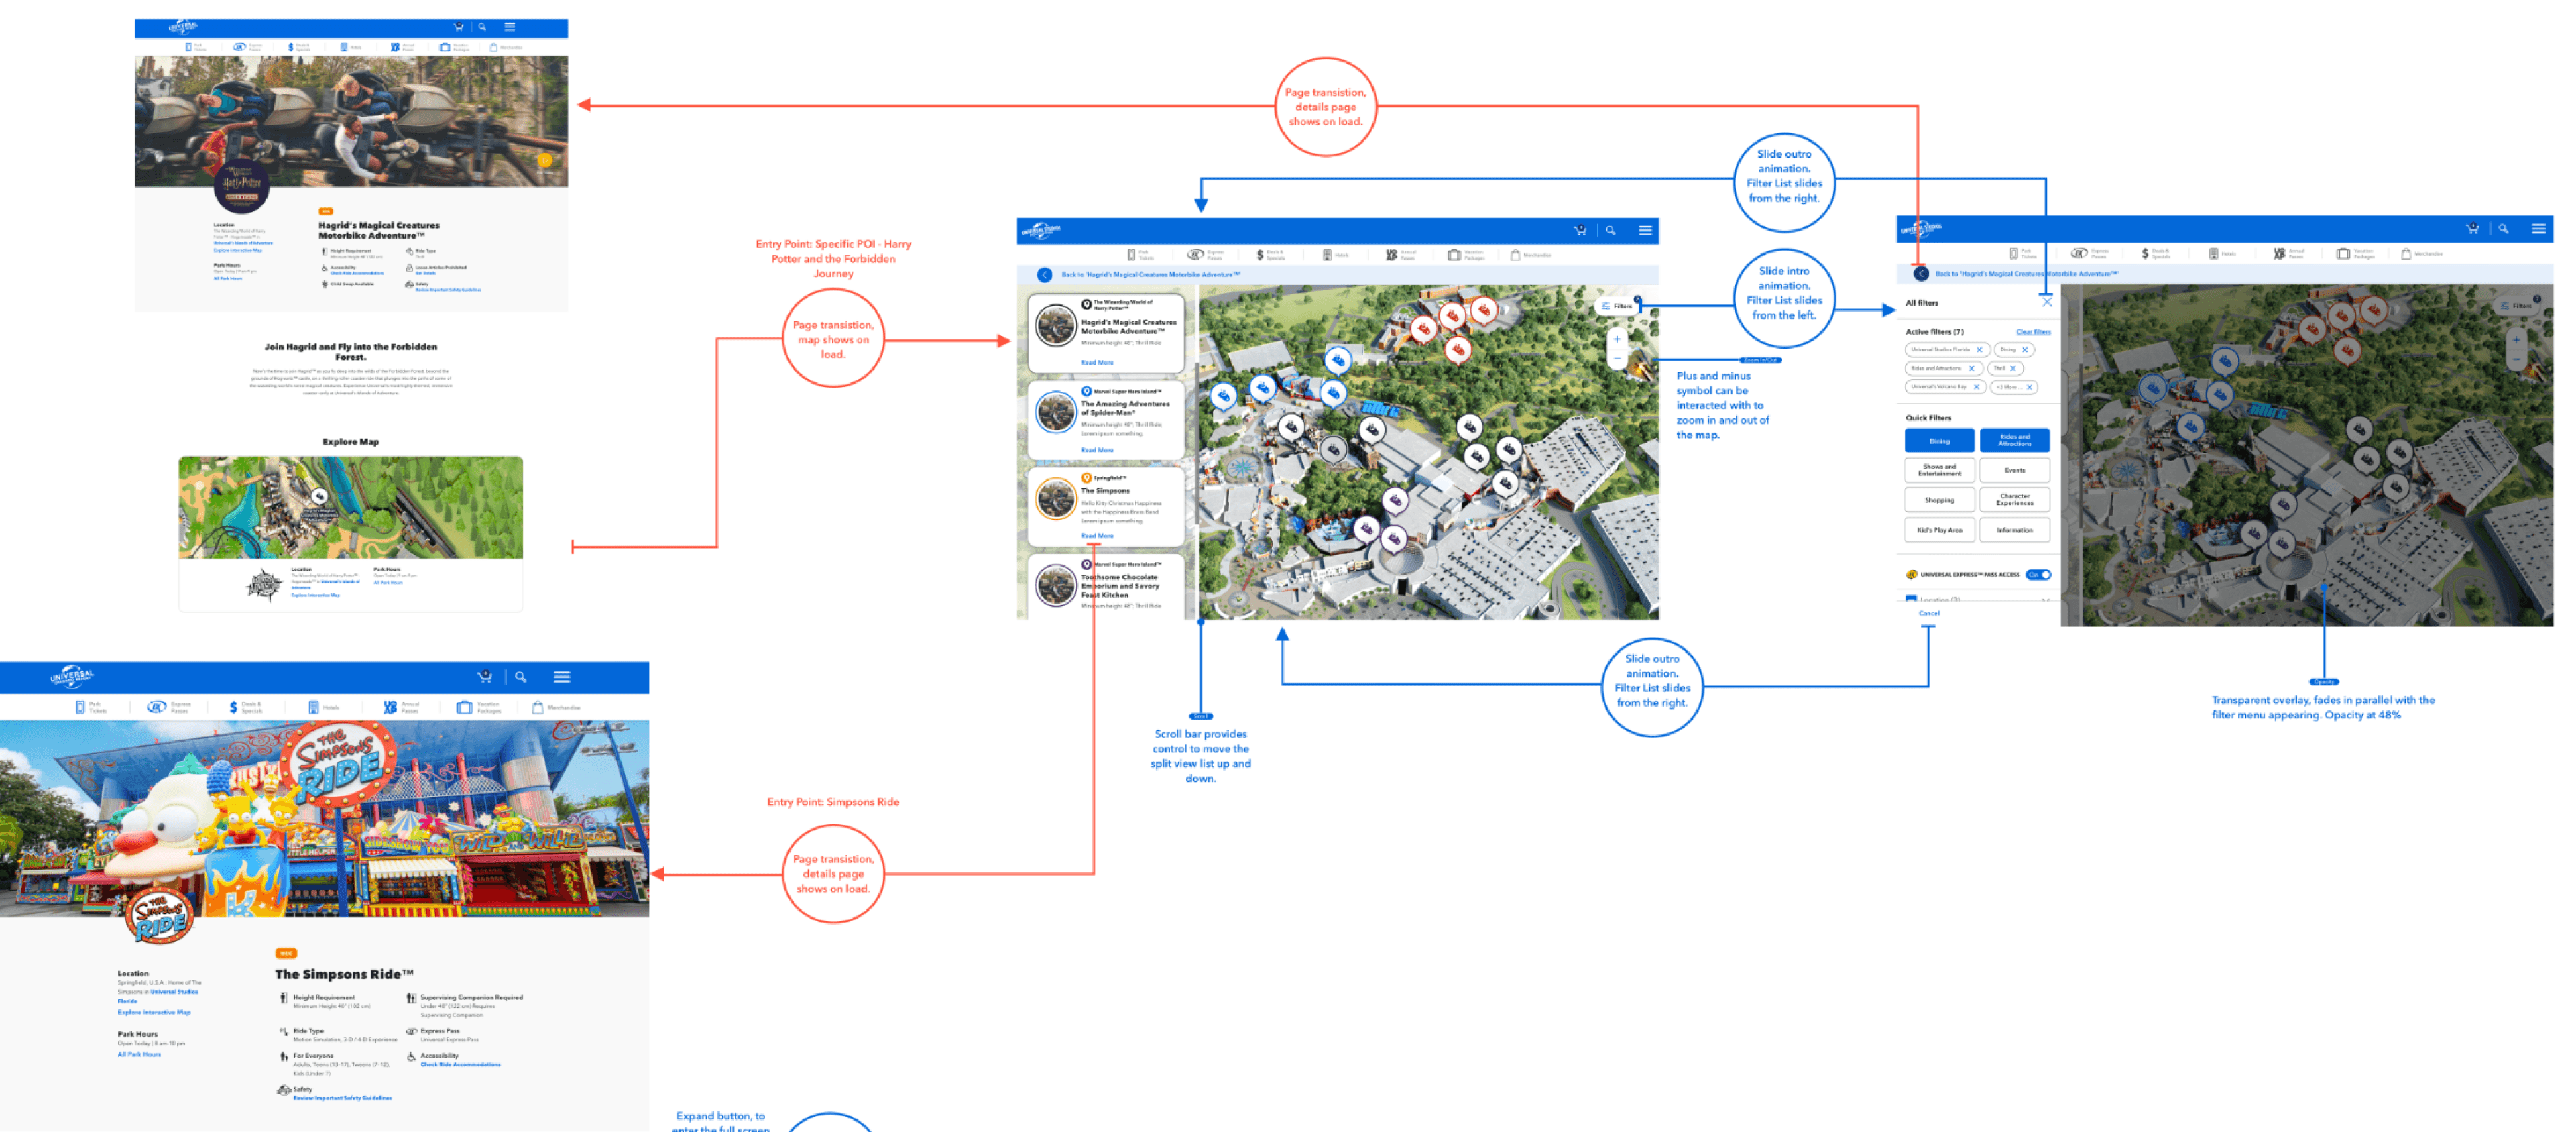
Following a month of meetings to discuss updates and progress, I emphasized to the product team the importance of involving developers as we moved forward.
Once the engineers were included in the conversation, design ideas naturally scaled down without friction. We focused on improving the interactive map based on three core design principles.
Interaction First
Clear Signifiers

Immediate Response


Global Integration: Hollywood and Japan
With the interactive map established and major design elements fleshed out and approved, it was time to synchronize with teams around the world.
I had the opportunity to present my work to the Universal Hollywood team and Japan for the first time. We discussed our journey, including the heuristic evaluation and research results that guided our decisions.

Collaboration with Chaos and Dojo:
The final synchronization required internal alignment between the agency I worked for and the agency housing the other designers. During the critical phases of high-fidelity iteration, a brief silo occurred due to time constraints, which was not the fault of any one party.
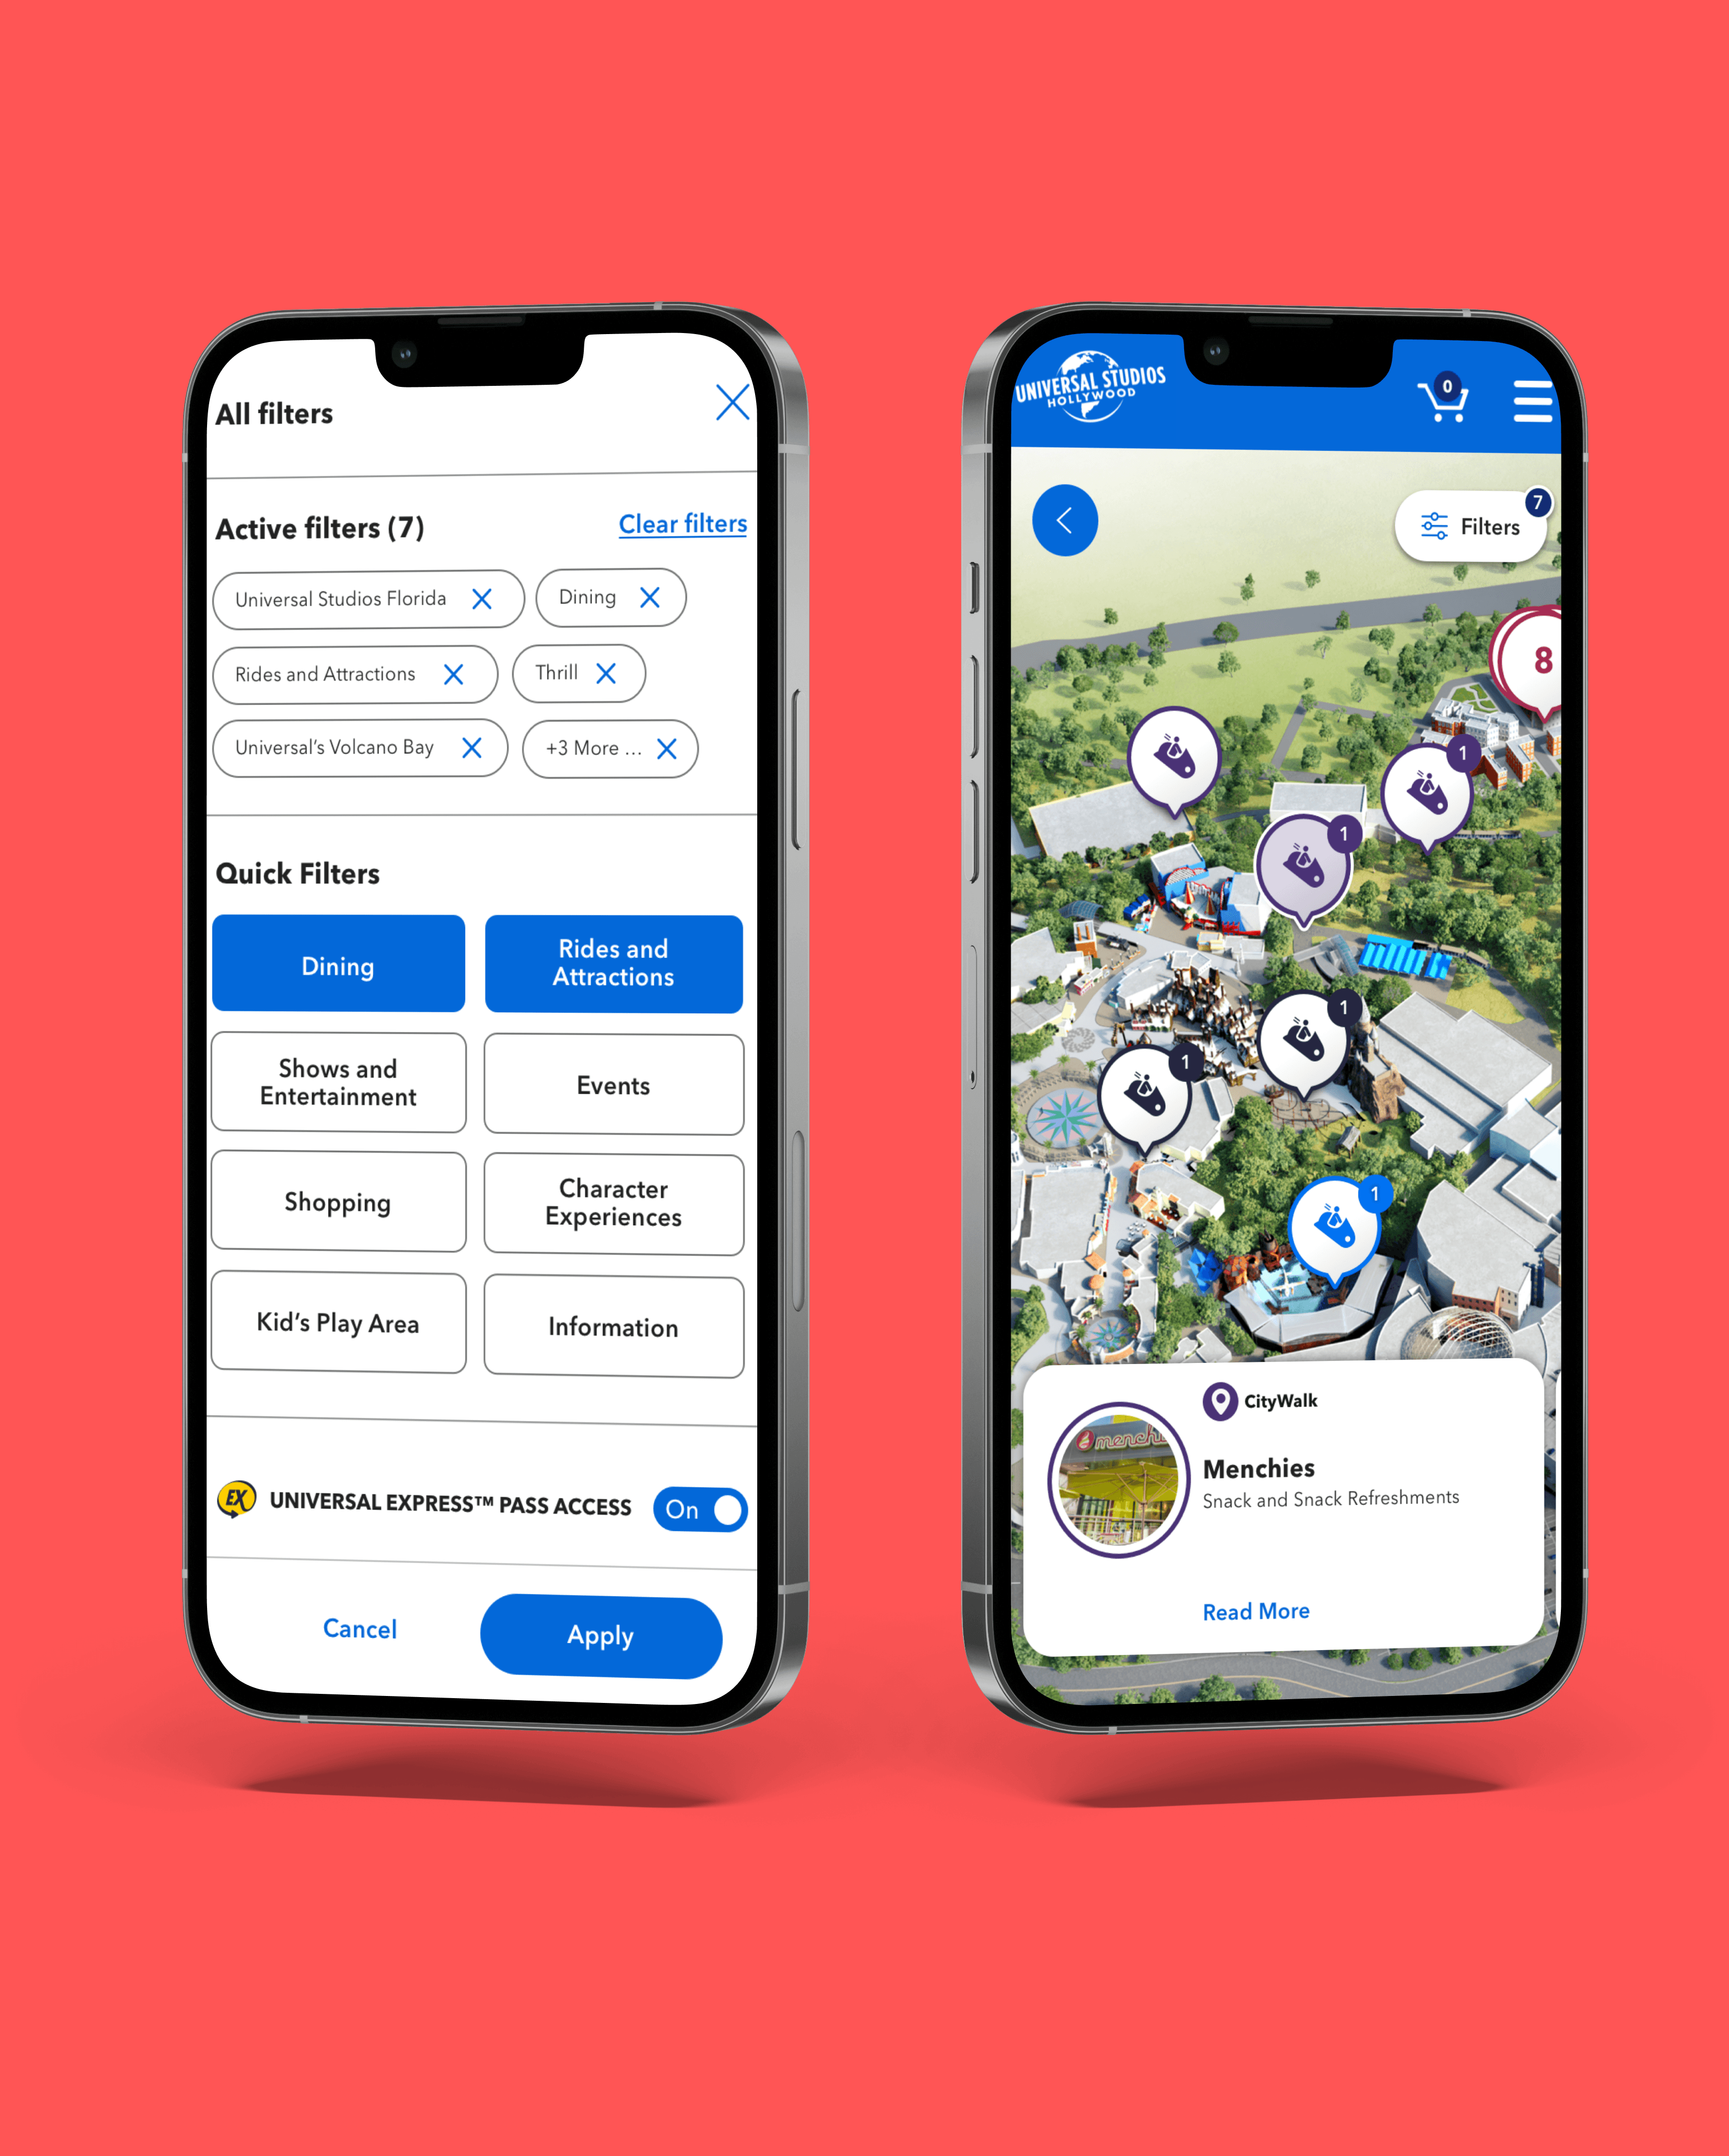
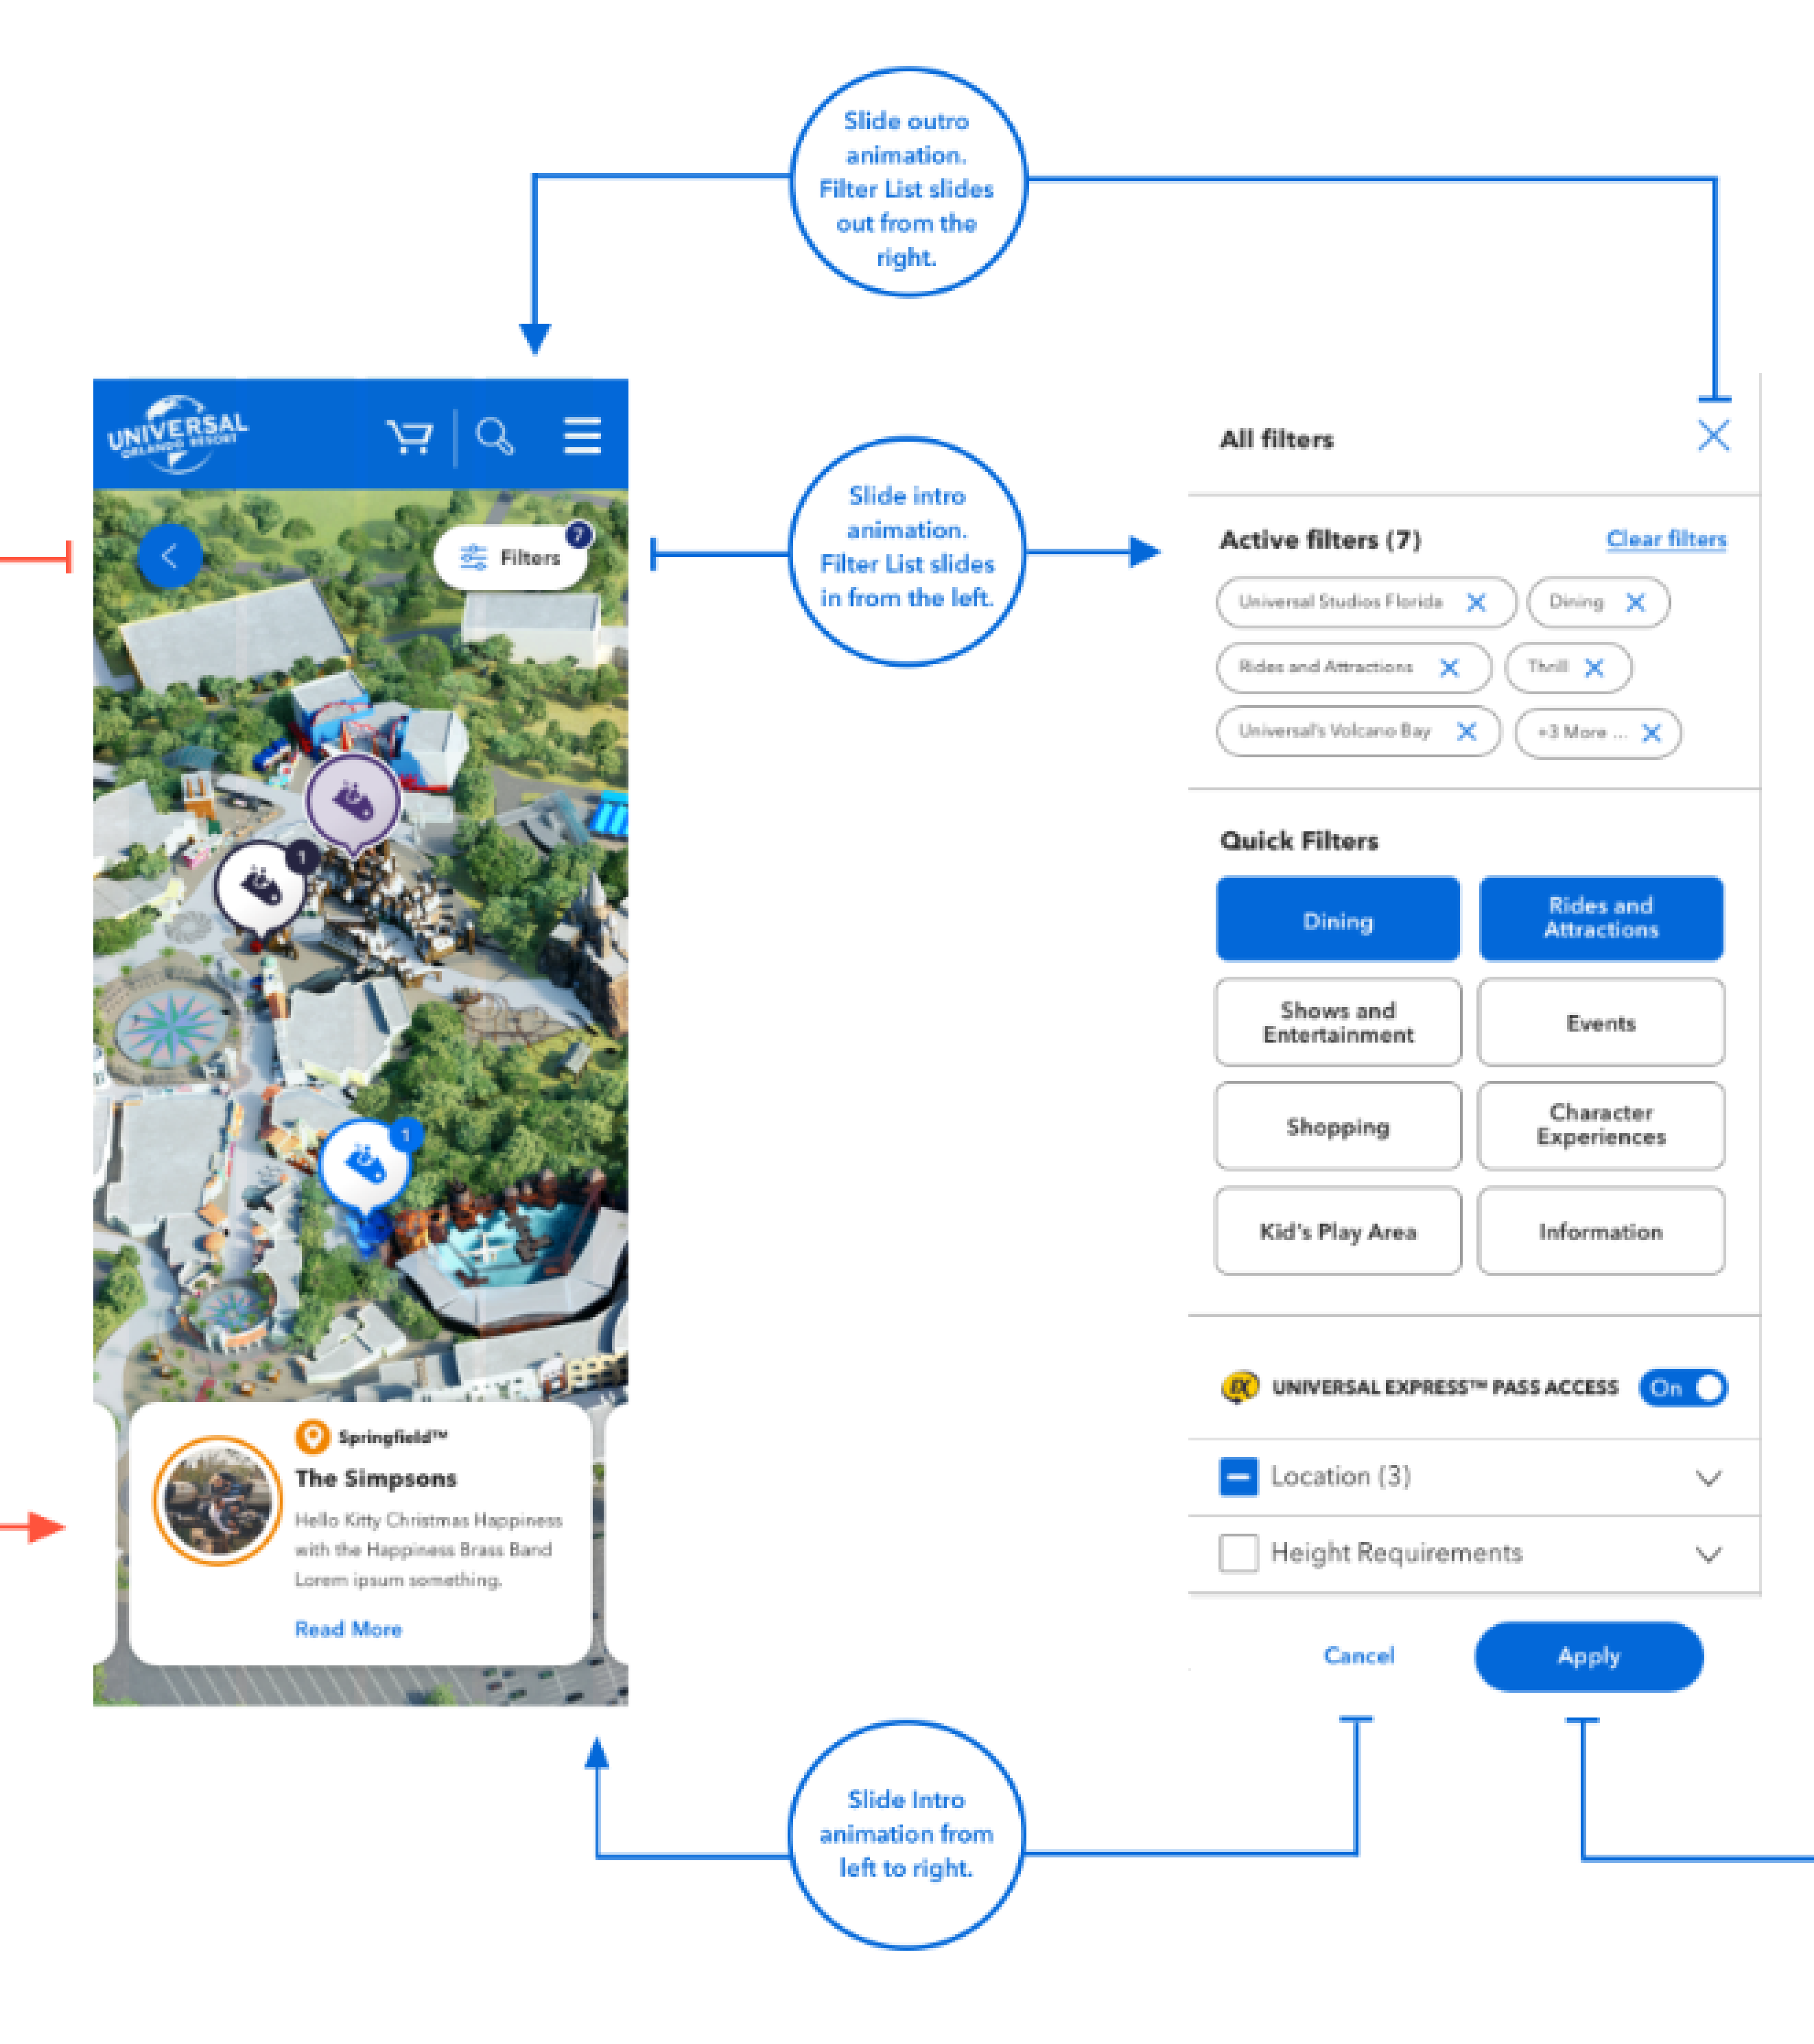
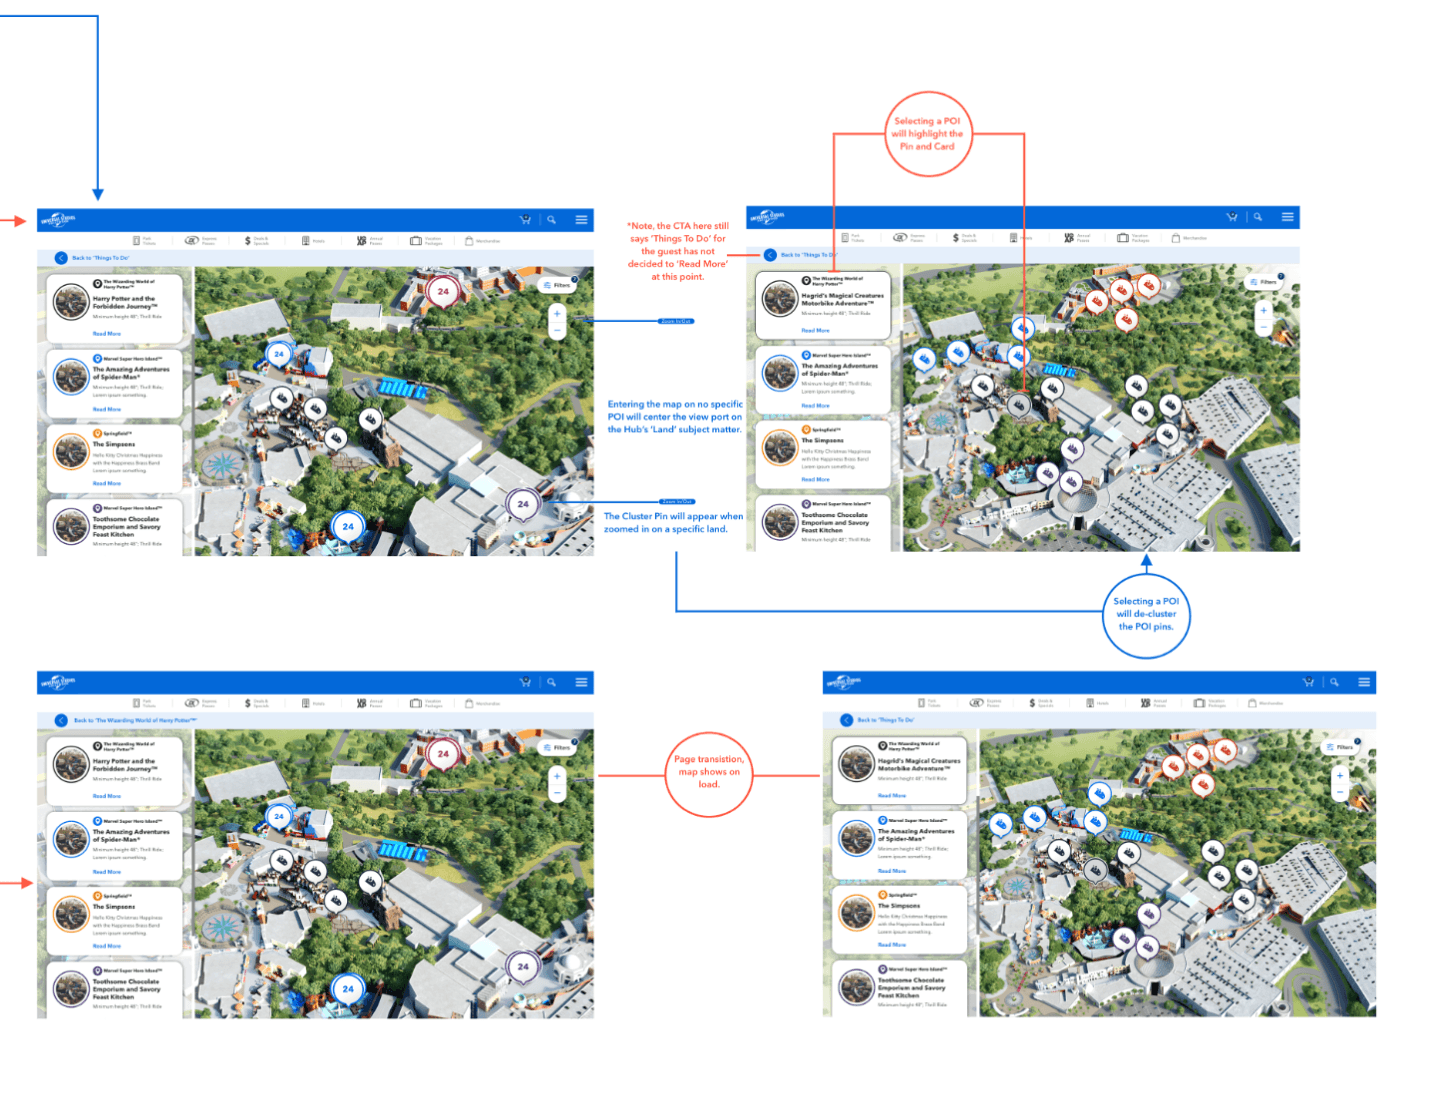
However, through quick thinking and the talent of the design team at Dojo, we identified research and design solutions that could be integrated seamlessly between our teams. By combining the interactive maps and the filtered list component within the Universal ecosystem, the product transitioned successfully into its documentation phase.
Currently, the Interactive Map is in its launch phase, progressing through engineering pipelines for deployment across Universal regions worldwide. This marks a significant milestone in enhancing guest experiences across Universal Parks and Resorts.
Acknowledgements/Credits
I would like to extend my heartfelt thanks to the following individuals and teams for their exceptional guidance and support during this project:
Paola Reyes
Matt Wittkamp
The team at Universal
The team at Dojo
Rebecca Bar
I am truly grateful to God for bringing me close to each one of you and for His blessings throughout this journey. Thank you for your valuable contributions and collaboration.
Isaiah Morales
Universal Parks and Resorts
Interactive Park Maps
My Role:
Lead UX/UI Designer | UX Researcher | Product Designer | Prototyper
Product Description:
Universal Parks and Resorts’ Interactive Park Map, is a vital visual resource that allows prospective guests to plan their vacation.
Mission:
Universal Parks and Resorts heavily depended on an outdated interactive map on their website. My mission was to redesign it, adhering to modern design paradigms and accessibility standards.
How might we create an interactive map that enables first-time guests to Universal to easily discover points of interest (POIs) and learn about what the park offers before their visit?
Competitive Analysis/Research
Above is the map before my work in the re-design. I led a comprehensive competitive analysis of interactive tools to gain deep insights into the design landscape.
Leveraging secondary research data from the Baymard Institute, I utilized a repository of HCI (Human-Computer Interaction) research to evaluate competitor design successes and pain points.

This effort resulted in a Heuristic Evaluation guide that I used to communicate planned changes to the product and development teams.
Heuristic Evaluation Points
I used this research to not only assess the current state of the tools but also to outline my vision for enhancing design patterns and improving guest accessibility moving forward.
Low-fidelity Ideation
I used Mind Mapping and Rapid Ideation techniques to generate a diverse array of ideas, followed by a SWOT analysis to streamline options.
I identified two primary patterns for the interactive map's structure and developed low-fi models from there:
• After further refinement, I presented three design concepts (1a, 1b, and 2) to the team.
• The goal for primary research: test two distinct approaches to building the interactive map.

Primary Research
I coded data for each wireframe prototype, noting the pros and cons as the product team approved the concepts for testing.
Collaborating with my design partner, Rebecca Bar, and our partners at Dojo, we presented our data.
The research was conducted online with a group of anonymous volunteers.

Design Principles
Visibility of System Status.

H1
Recognition rather than recall.

H6
User Control and Freedom.

H3
High-fidelity Ideation


Global Integration: Hollywood and Japan
With the interactive map established and major design elements fleshed out and approved, it was time to synchronize with teams around the world.
I had the opportunity to present my work to the Universal Hollywood team and Japan for the first time. We discussed our journey, including the heuristic evaluation and research results that guided our decisions.
Collaboration with Chaos and Dojo:
The final synchronization required internal alignment between the agency I worked for and the agency housing the other designers. During the critical phases of high-fidelity iteration, a brief silo occurred due to time constraints, which was not the fault of any one party.
However, through quick thinking and the talent of the design team at Dojo, we identified research and design solutions that could be integrated seamlessly between our teams. By combining the interactive maps and the filtered list component within the Universal ecosystem, the product transitioned successfully into its documentation phase.
Currently, the Interactive Map is in its launch phase, progressing through engineering pipelines for deployment across Universal regions worldwide. This marks a significant milestone in enhancing guest experiences across Universal Parks and Resorts.
Acknowledgements/Credits
I would like to extend my heartfelt thanks to the following individuals and teams for their exceptional guidance and support during this project:
Paola Reyes
Matt Wittkamp
The team at Universal
The team at Dojo
Rebecca Bar
I am truly grateful to God for bringing me close to each one of you and for His blessings throughout this journey. Thank you for your valuable contributions and collaboration.
Isaiah Morales
Universal Parks and Resorts
Interactive Park Maps
My Role:
Lead UX/UI Designer | UX Researcher | Product Designer | Prototyper
Product Description:
Universal Parks and Resorts’ Interactive Park Map, is a vital visual resource that allows prospective guests to plan their vacation and explore thrilling attractions across Universal's suite of parks.
Mission:
Universal Parks and Resorts heavily depended on an outdated interactive map on their website. My mission was to redesign it, adhering to modern design paradigms and accessibility standards.
I tackled the redesign of an interactive tool using a pre-existing design system that I was encountering for the first time:
• This project marked the first update to the interactive map since the early 2000s, presenting a vast landscape of immersion and ideation.
• I led the ideation on this cross functional design project, collaborating on a cross-company level and integrating an external design system into my workflow.
How might we create an interactive map that enables first-time guests to Universal to easily discover points of interest (POIs) and learn about the park's offers before their visit?
Outcome:
I collaborated with Universal product leads and internal designers to understand their design objectives and product principles by using their Global Design System (GDS).

Competitive Analysis/Research
Above is the map before my redesign work. I conducted a thorough competitive analysis of interactive tools to gain insights into the design landscape.
I used Baymard Institute's secondary data and HCI research to evaluate competitors' design successes and pain points.
This effort resulted in a Heuristic Evaluation guide, which I used to communicate planned changes to the product and development teams.
Heuristic Evaluation Points
The heuristics from the Baymard Institute guided the primary research study later on.
Competitive Analysis - Design Opportunities:
Identified clear signifiers that grab attention and effectively communicate usage.
Analyzed the hierarchy and placement of search tools to enhance the visibility and usability of the interactive map.
Improved the clarity of in-park jargon and established information architecture patterns for Points of Interest (POIs).
Communicated the necessity of testing various interaction patterns during the design phase.
I used this research not only to assess the current state of the tools but also to outline my vision for enhancing design patterns and improving guest accessibility moving forward.
Low-fidelity Ideation
I spearheaded the initial ideation phase once the team reached a consensus on project objectives.
I used Mind Mapping and Rapid Ideation techniques to generate a diverse array of ideas, followed by a SWOT analysis to streamline options.
I identified two primary patterns for the interactive map's structure and developed low-fi models from there:
• After further refinement, I presented three design concepts (1a, 1b, and 2) to the team.
• The goal for primary research: test two distinct approaches to building the interactive map.


Primary Research
I coded data for each wireframe prototype, noting the pros and cons as the product team approved the concepts for testing.
Collaborating with my design partner, Rebecca Bar, and our partners at Dojo, we presented our data.
The research was conducted online with a group of anonymous volunteers.
Design Principles
User Control and Freedom.
Recognition rather than recall.
Visibility of System Status.


H1
H6
H3
Mid-fidelity Ideation
Armed with clear data indicating the most promising prototype, I presented our findings.
Referencing insights from the heuristic evaluation, I demonstrated how each prototype identified issues.
Correlating this with the research data further strengthened the case for selecting the optimal prototype to iterate upon.
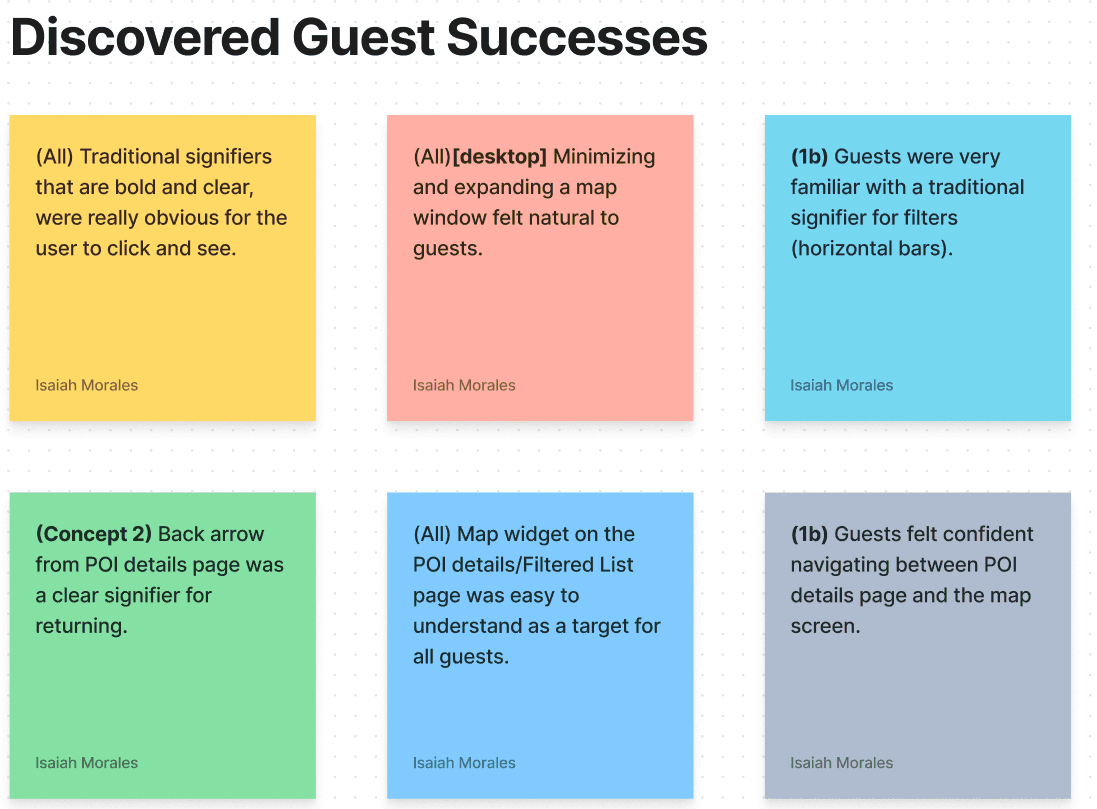
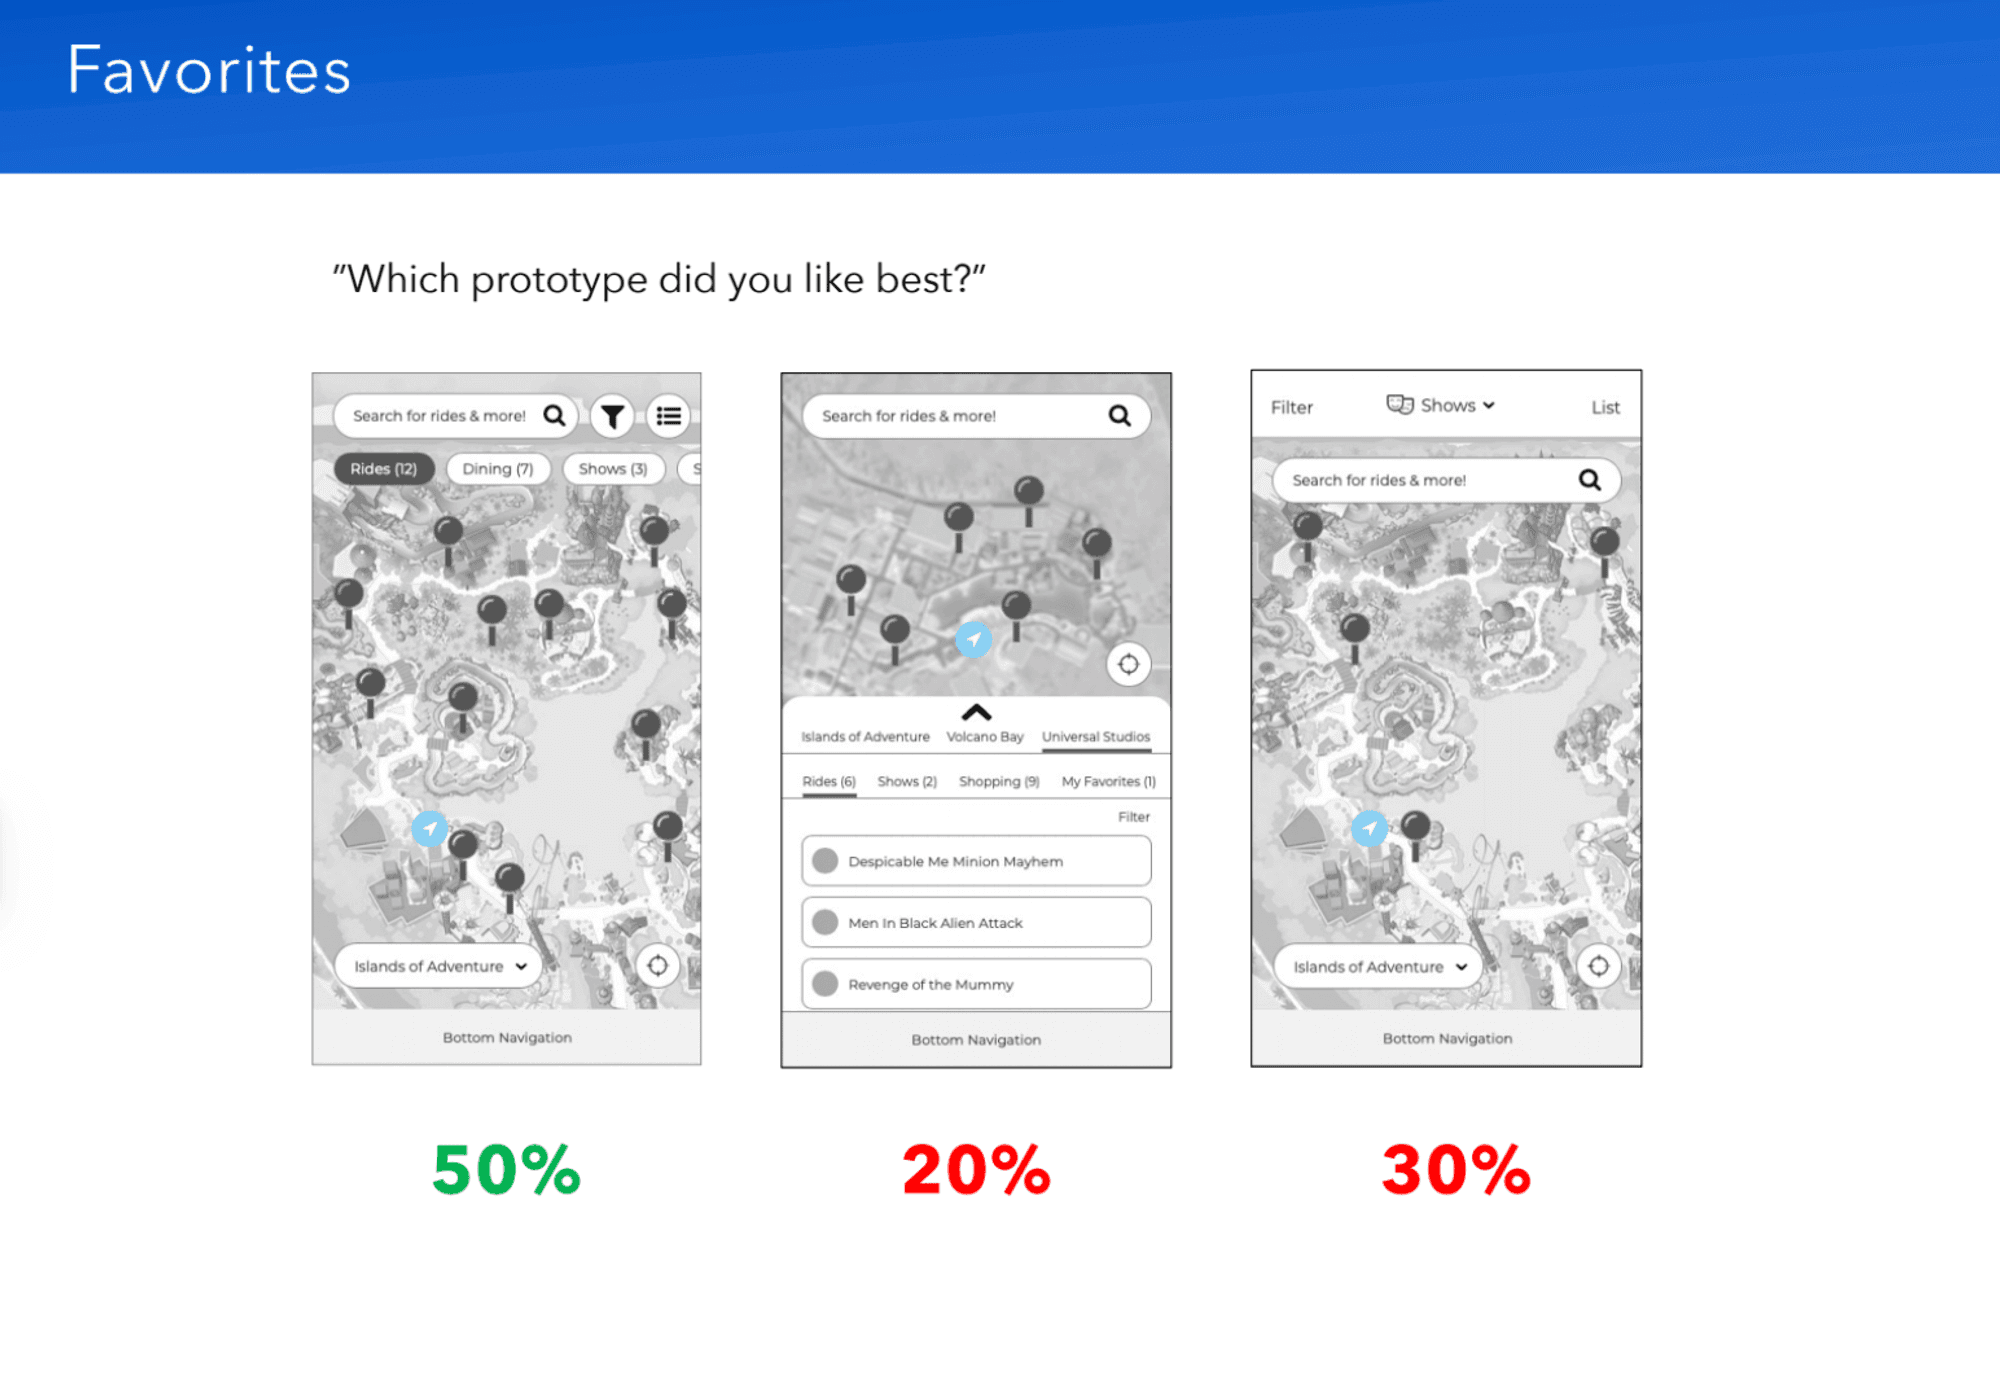
The product team gained a fundamental understanding of the direction based on user insights. I welcomed their input on incorporating elements from other prototypes if desired.
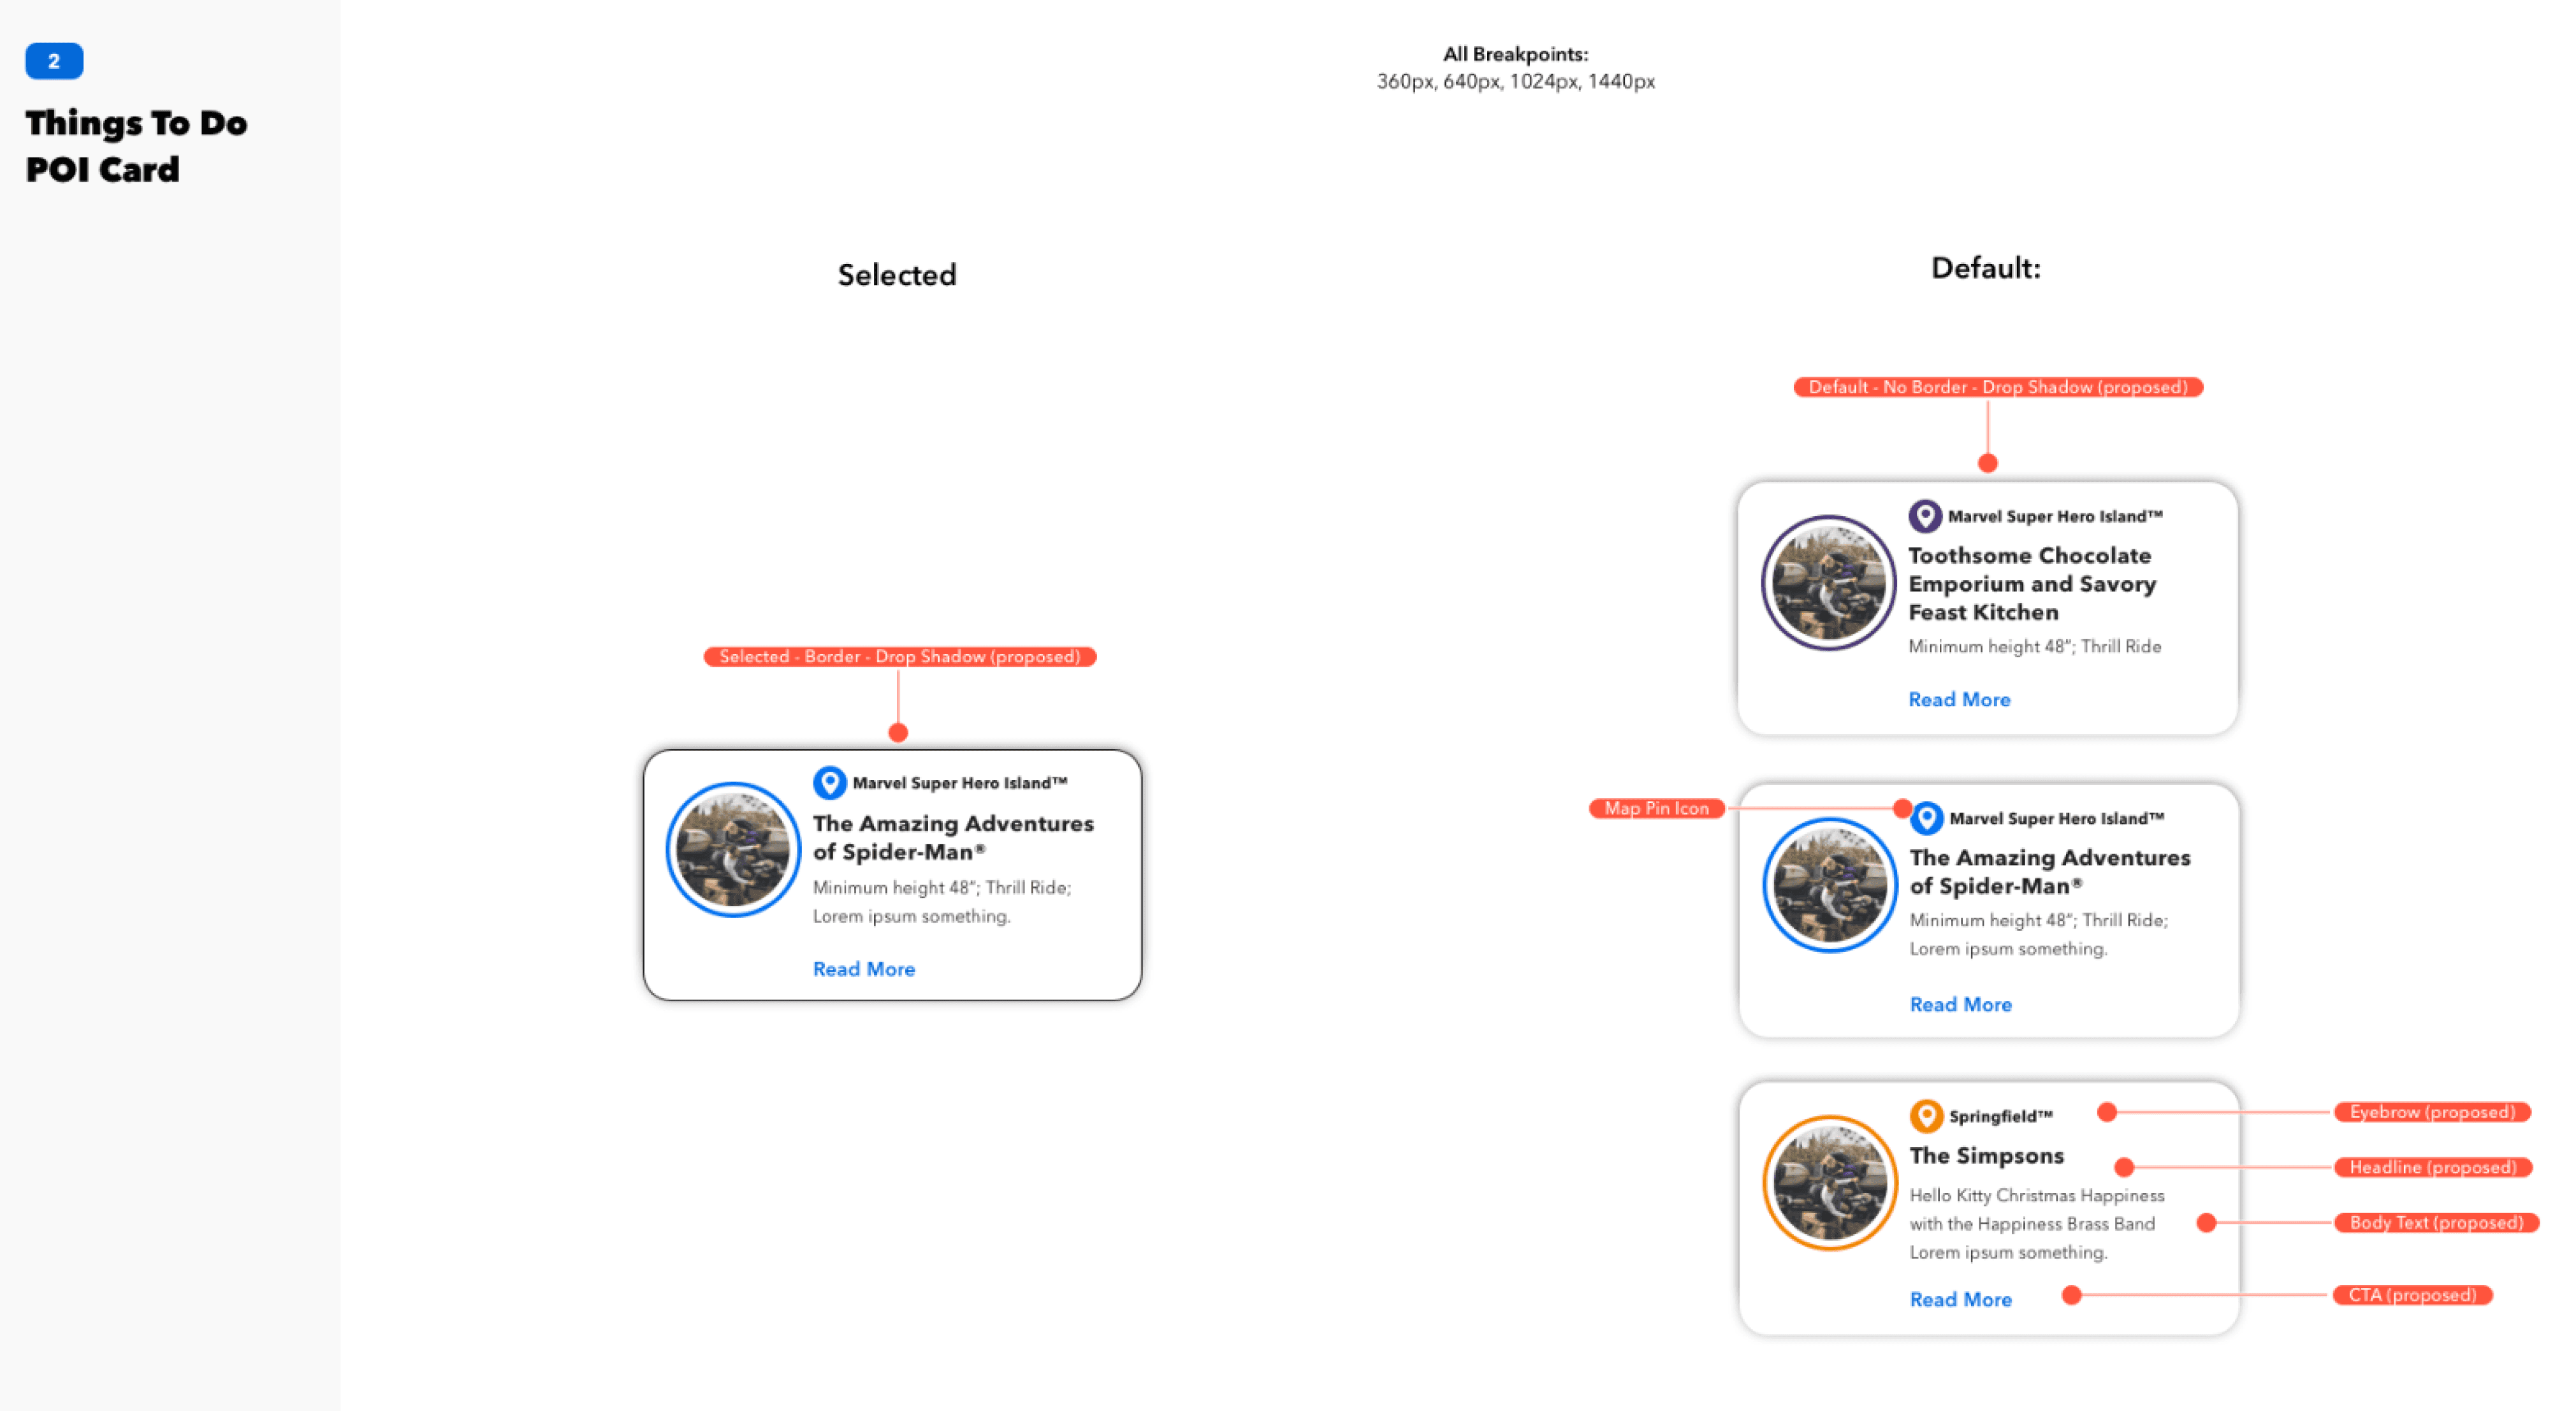
High-fidelity Ideation
Following a month of meetings to discuss updates and progress, I emphasized to the product team the importance of involving developers as we moved forward.
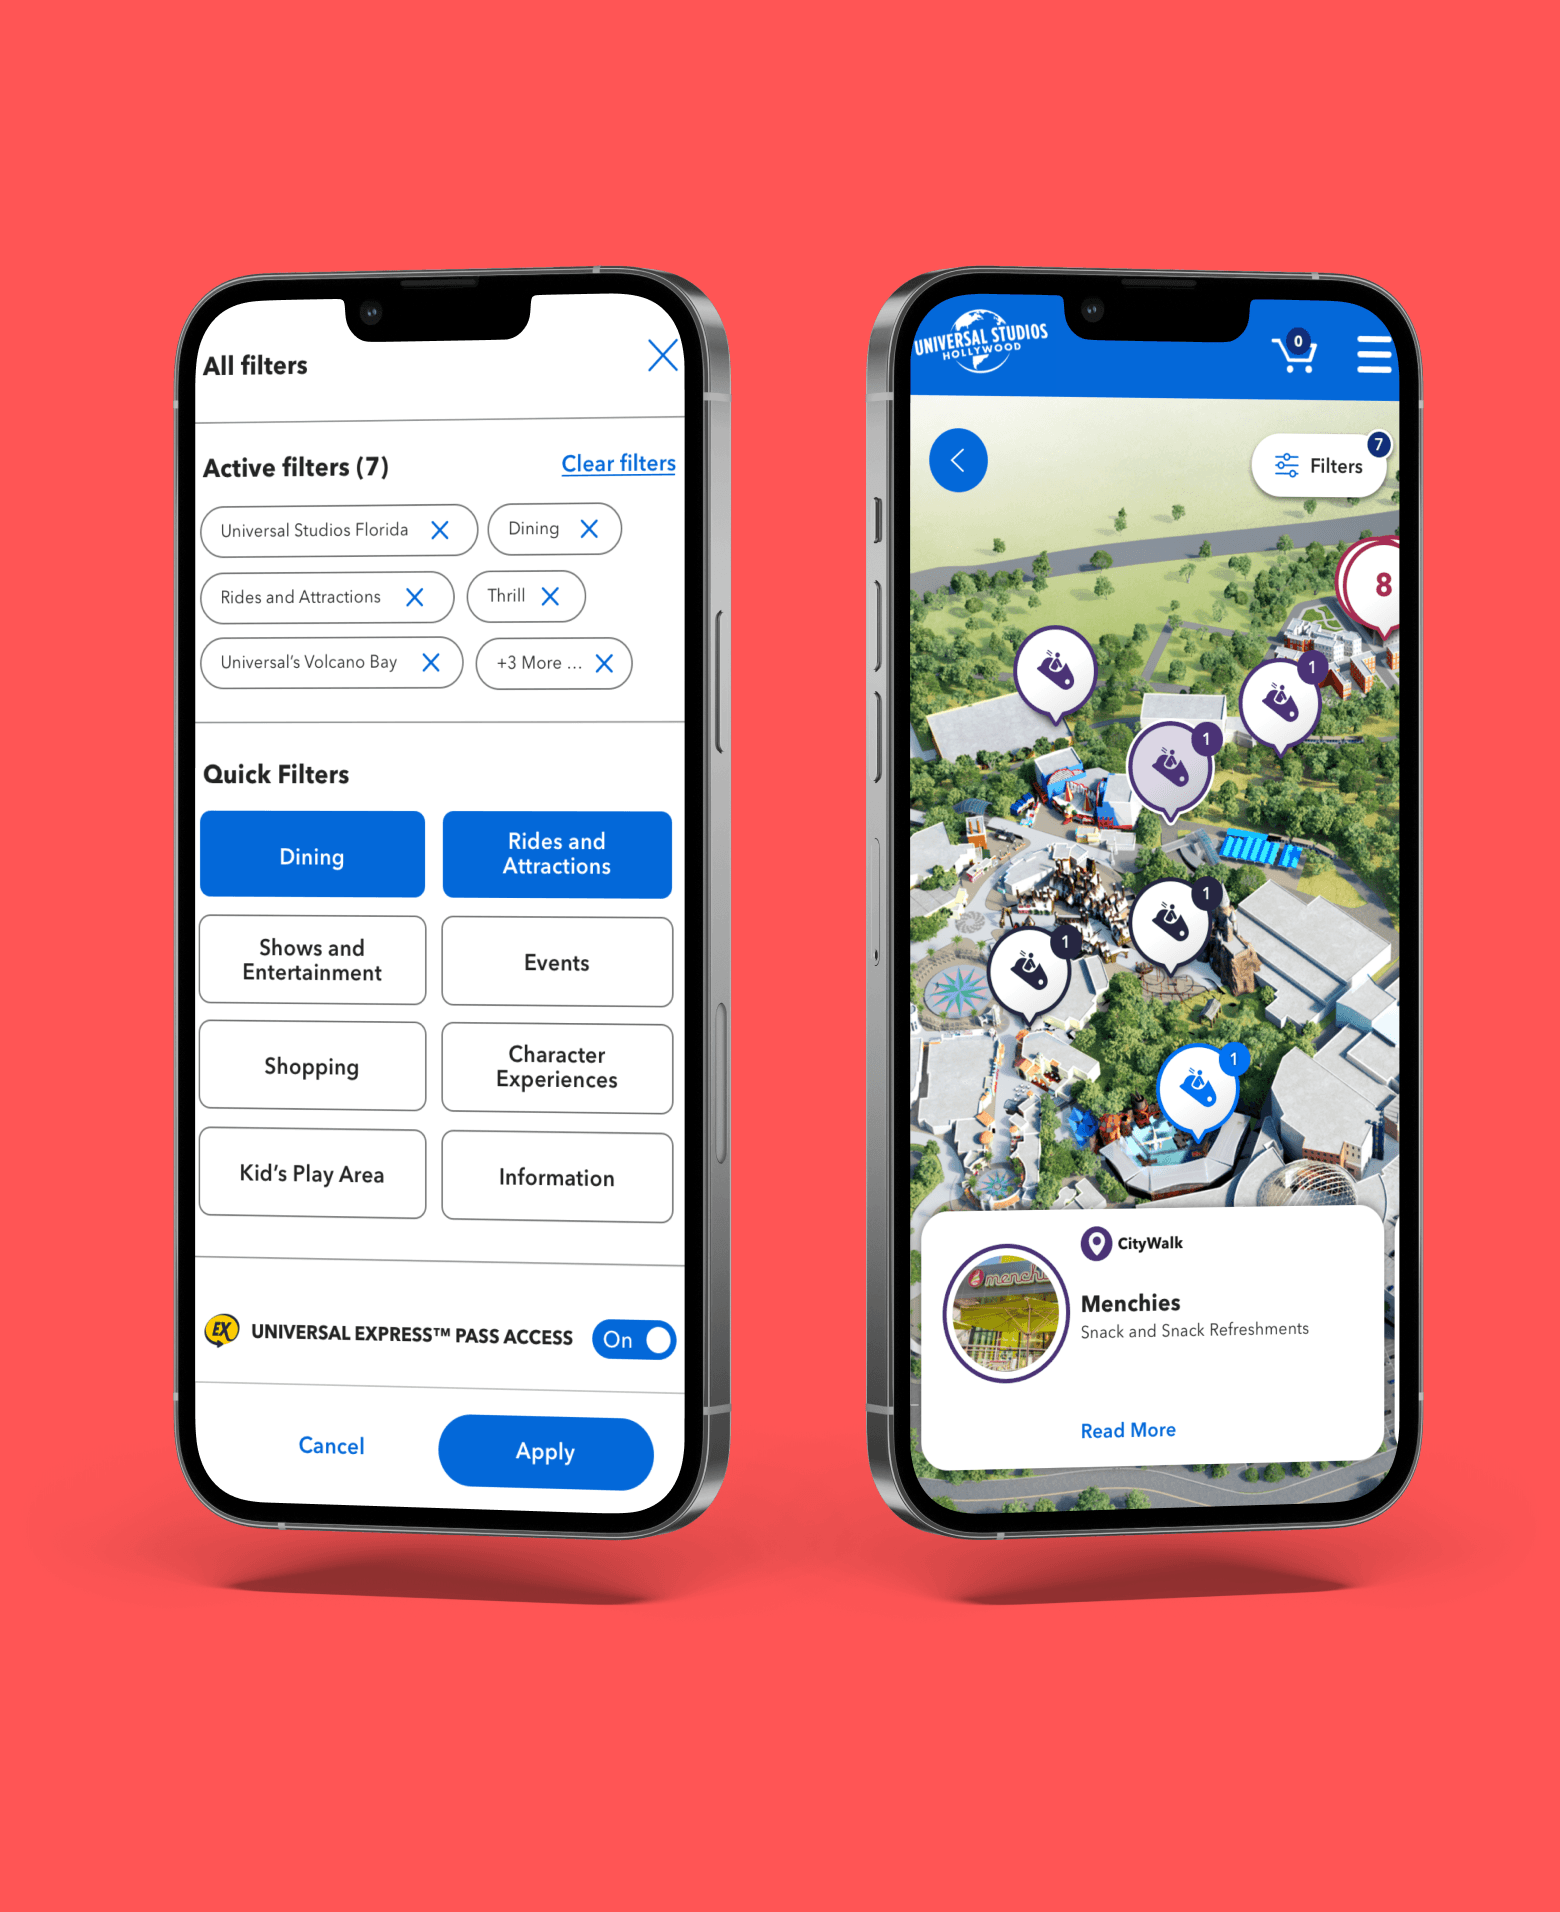
Once the engineers were included in the conversation, design ideas naturally scaled down without friction. We focused on improving the interactive map based on three core design principles: 'Interaction First', 'Clear Signifiers', and 'Immediate Response'.
Interaction First
Clear Signifiers

Immediate Response


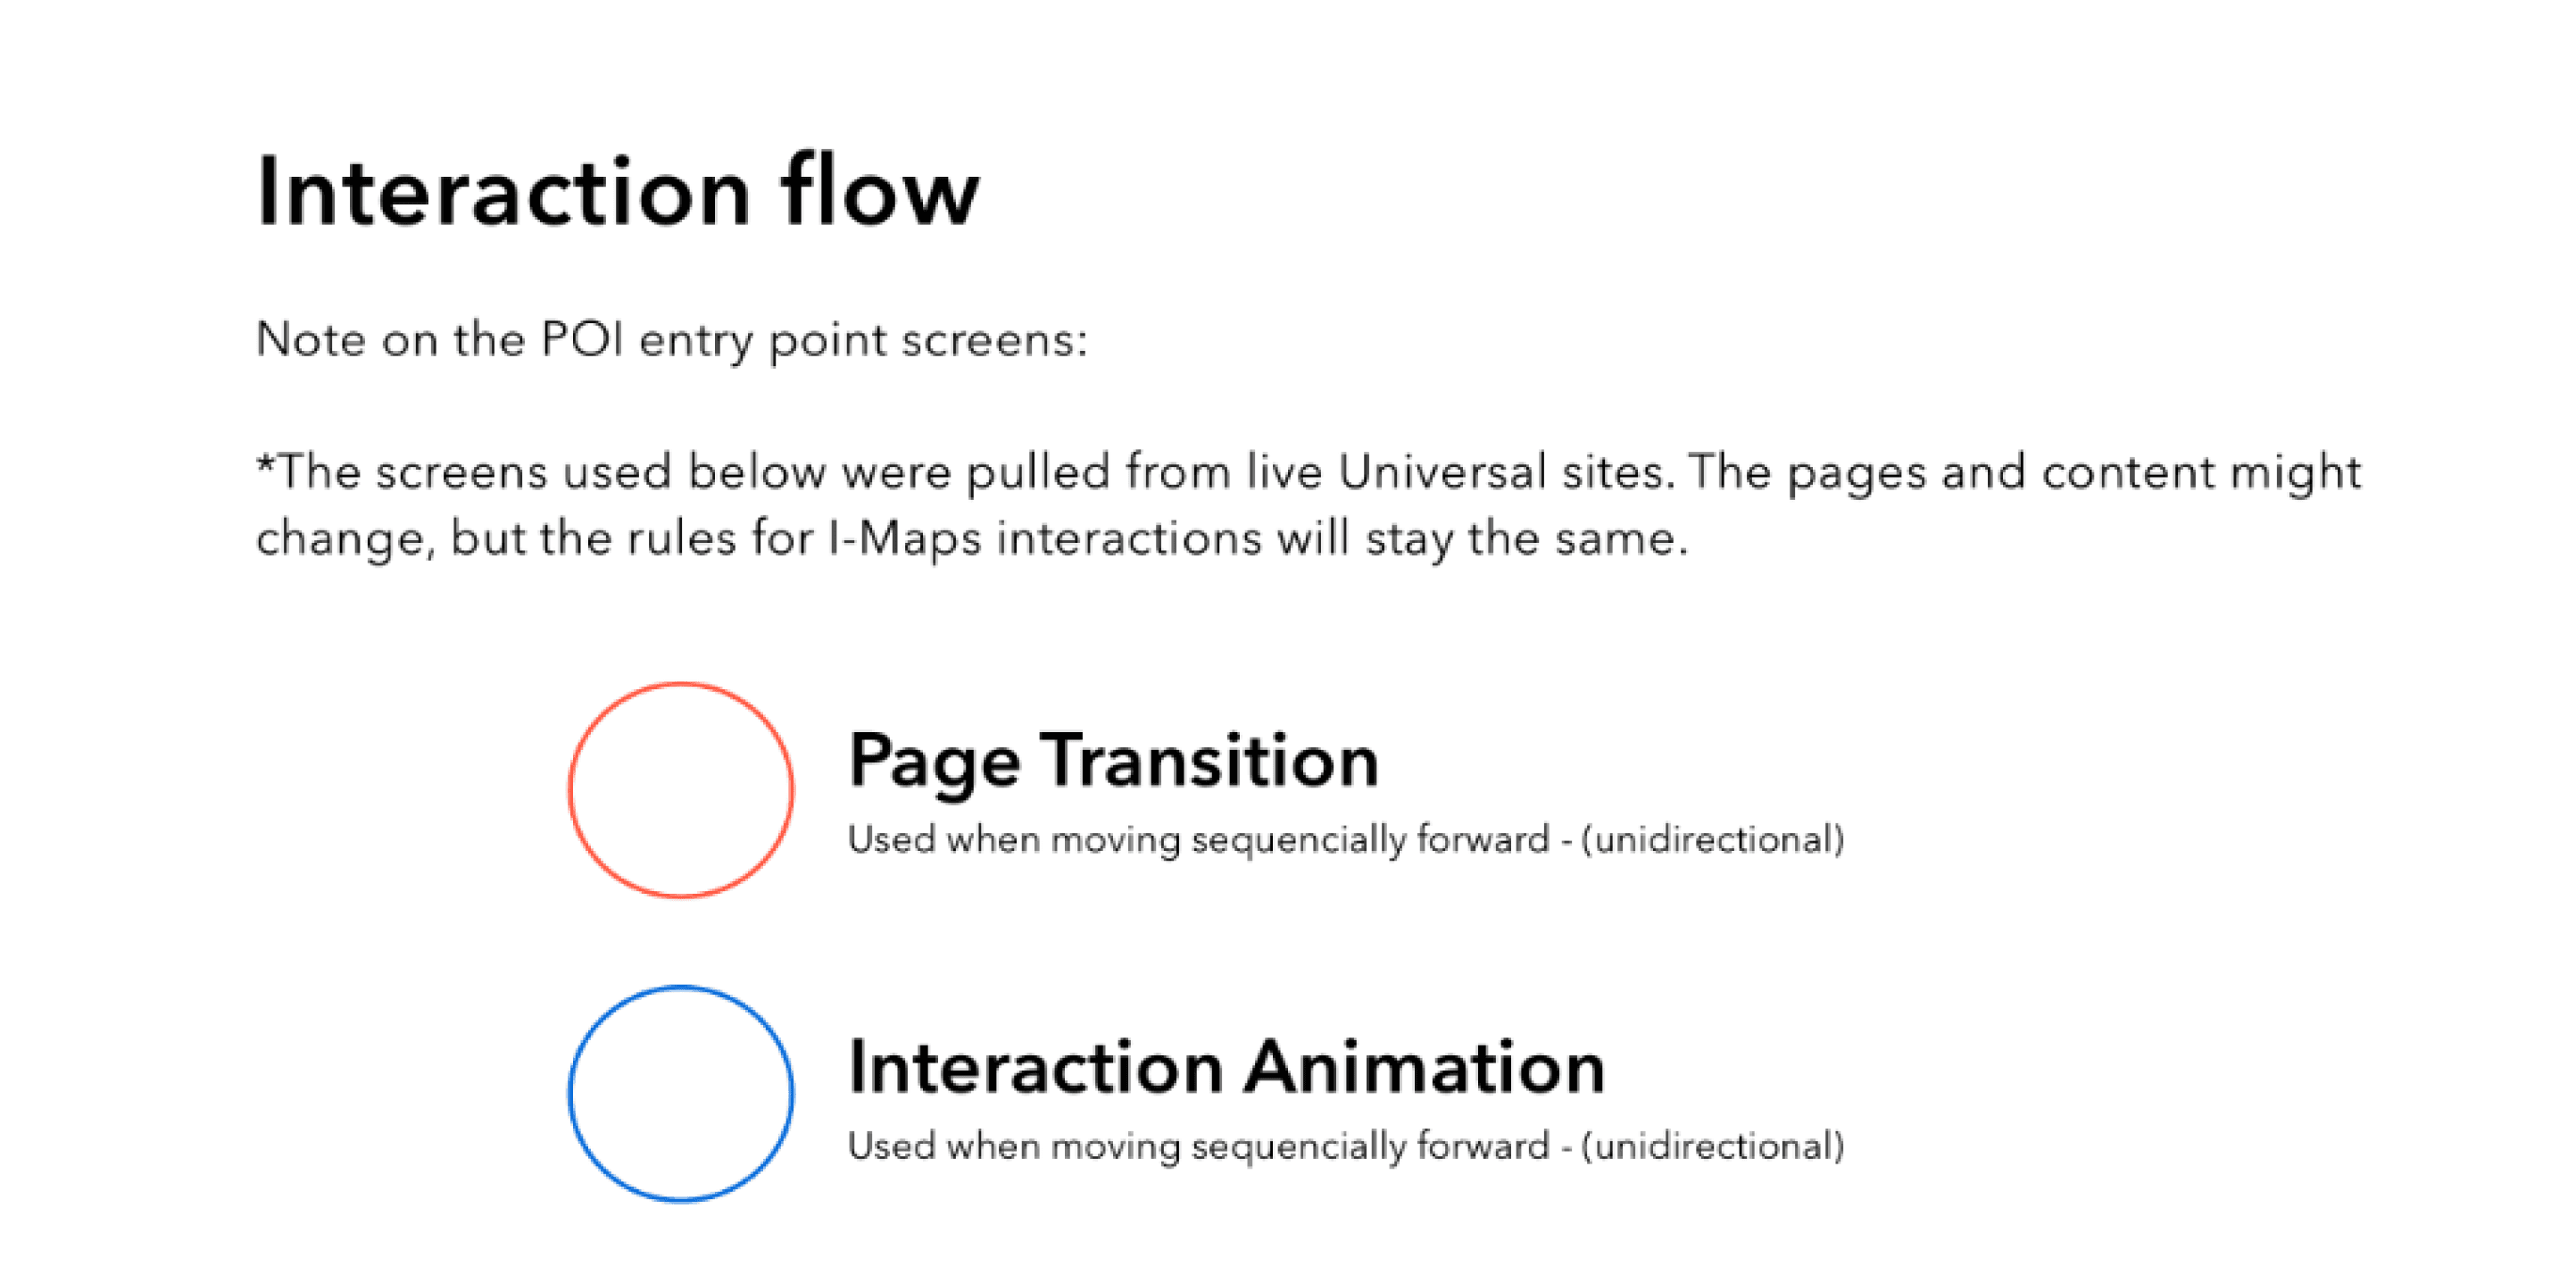
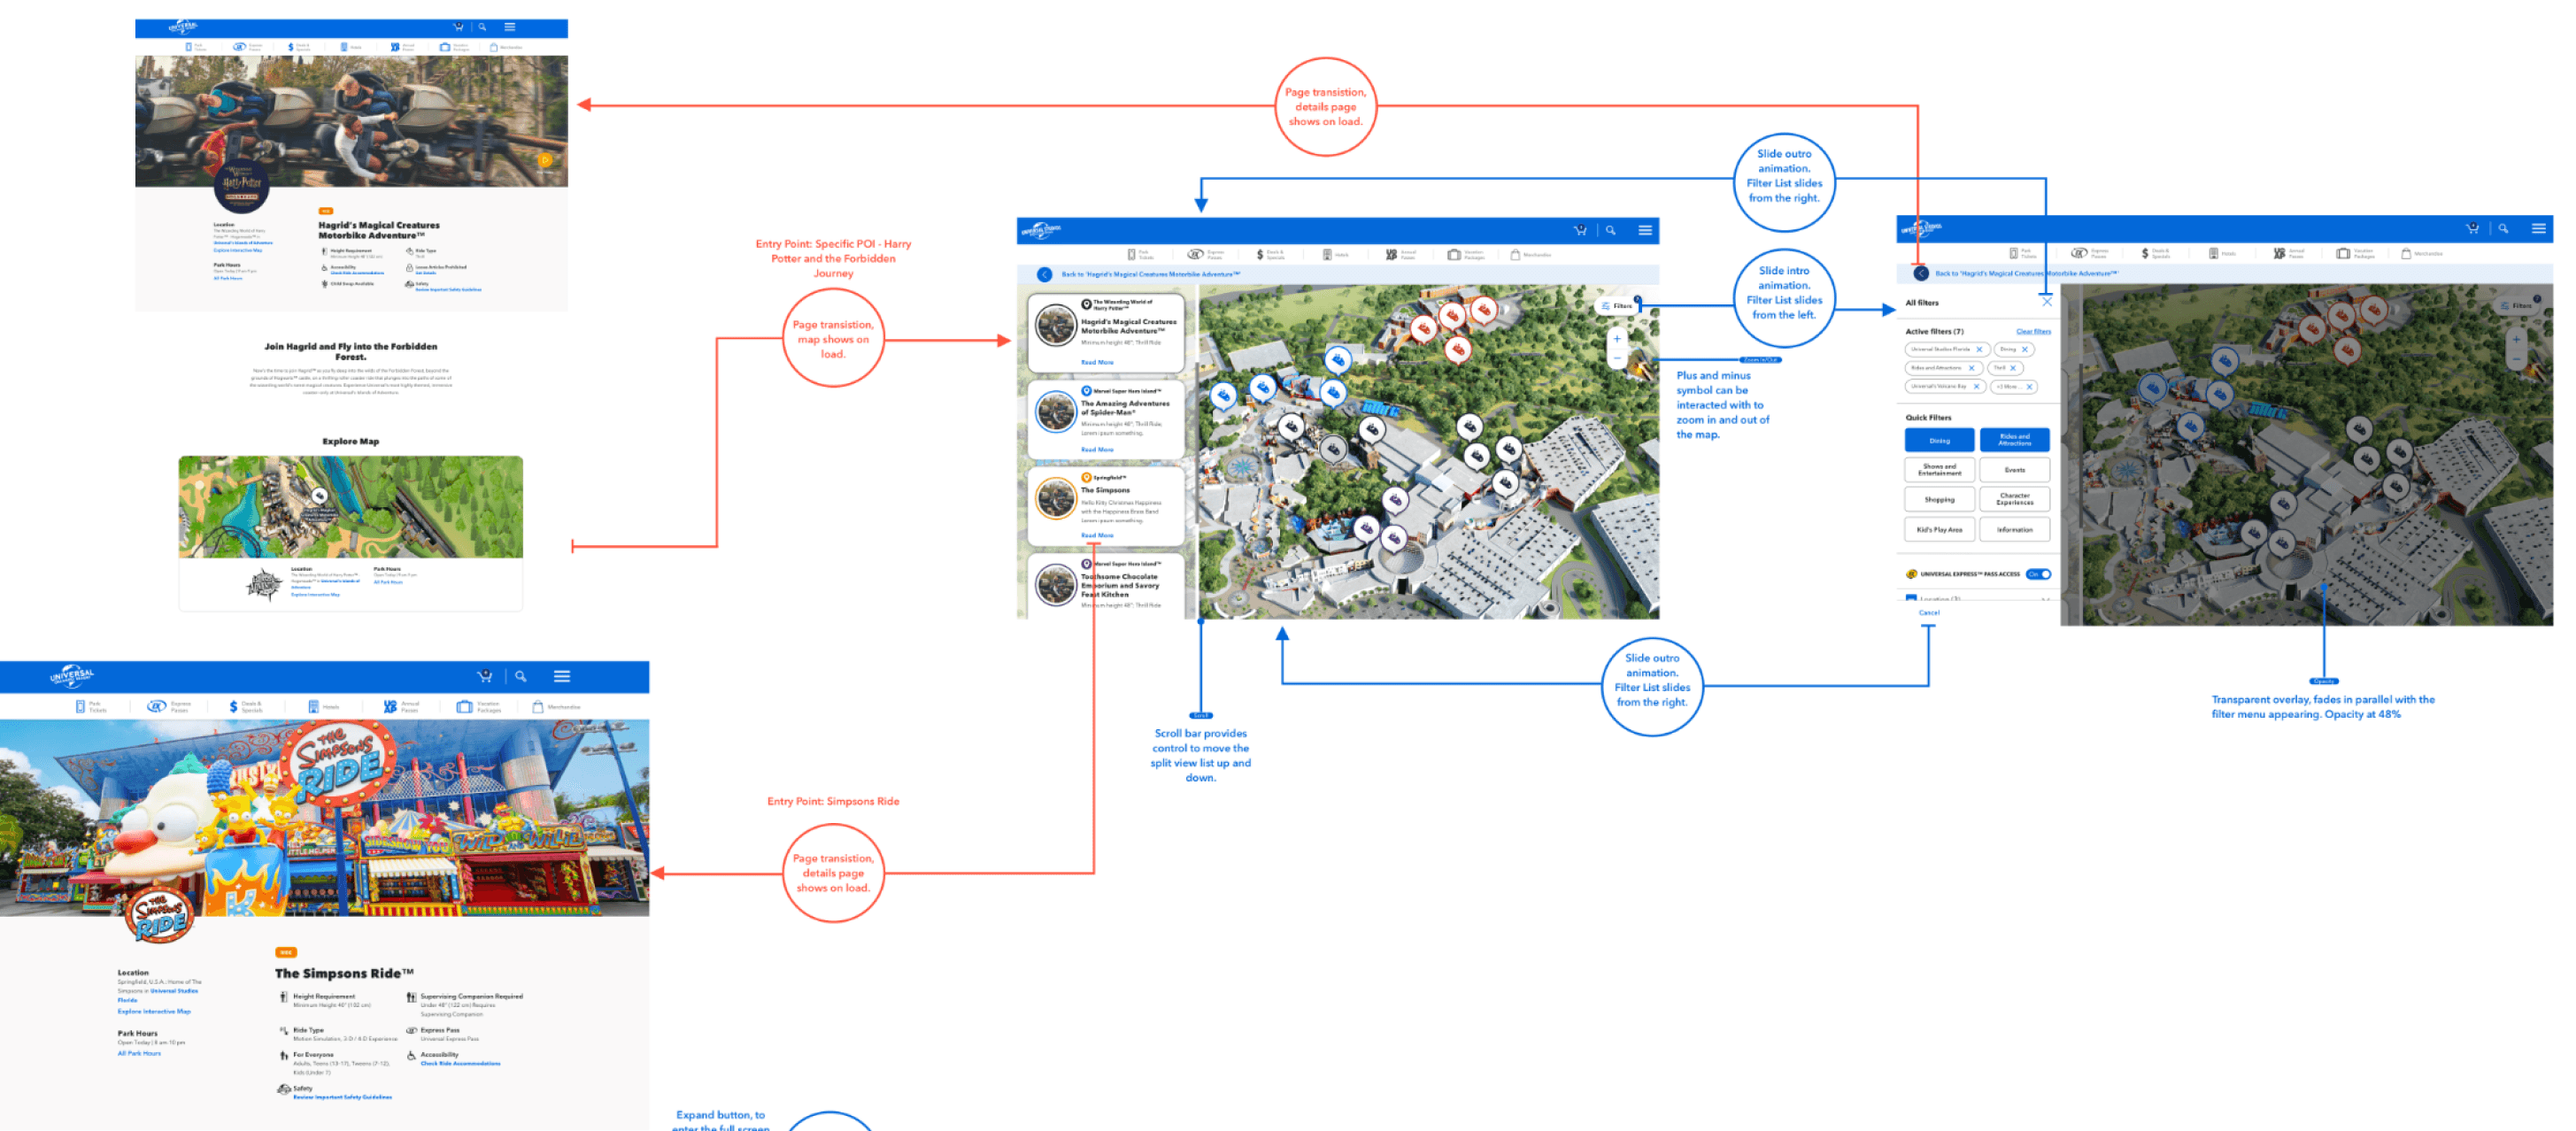
Global Integration: Hollywood and Japan
With the interactive map established and major design elements fleshed out and approved, it was time to synchronize with teams around the world.
I had the opportunity to present my work to the Universal Hollywood team and Japan for the first time. We discussed our journey, including the heuristic evaluation and research results that guided our decisions.
Collaboration with Chaos and Dojo
The final synchronization required internal alignment between the agency I worked for and the agency housing the other designers. During the critical phases of high-fidelity iteration, a brief silo occurred due to time constraints, which was not the fault of any one party.
However, through quick thinking and the talent of the design team at Dojo, we identified research and design solutions that could be integrated seamlessly between our teams. By combining the interactive maps and the filtered list component within the Universal ecosystem, the product transitioned successfully into its documentation phase.
Currently, the Interactive Map is in its launch phase, progressing through engineering pipelines for deployment across Universal regions worldwide. This marks a significant milestone in enhancing guest experiences across Universal Parks and Resorts.
I would like to extend my heartfelt thanks to the following individuals and teams for their exceptional guidance and support during this project:
->Paola Reyes
->Matt Wittkamp
->The team at Universal
->The team at Dojo
->Rebecca Bar
I am truly grateful to God for bringing me close to each one of you and for His blessings throughout this journey. Thank you for your valuable contributions and collaboration.
Universal Parks and Resorts
Interactive Park Maps
My Role:
Lead UX/UI Designer | UX Researcher | Product Designer | Prototyper
Product Description:
Universal Parks and Resorts’ Interactive Park Map, is a vital visual resource that allows prospective guests to plan their vacation and explore thrilling attractions across Universal's suite of parks.
Universal Parks and Resorts heavily depended on an outdated interactive map on their website. My mission was to redesign it, adhering to modern design paradigms and accessibility standards.
I tackled the redesign of an interactive tool using a pre-existing design system that I was encountering for the first time:
• This project marked the first update to the interactive map since the early 2000s, presenting a vast landscape of immersion and ideation.
• I led the ideation on this cross functional design project, collaborating on a cross-company level and integrating an external design system into my workflow.
How might we create an interactive map that enables first-time guests to Universal to easily discover points of interest (POIs) and learn about what the park offers before their visit?
I collaborated with Universal product leads and internal designers to understand their design objectives and product principles by using their Global Design System (GDS).
Competitive Analysis/Research
Above is the map before my redesign work. I conducted a thorough competitive analysis of interactive tools to gain insights into the design landscape.
I used Baymard Institute's secondary data and HCI research to evaluate competitors' design successes and pain points.

This effort resulted in a Heuristic Evaluation guide, which I used to communicate planned changes to the product and development teams.
Heuristic Evaluation Points
The heuristics from the Baymard Institute guided the primary research study later on.
Competitive Analysis - Design Opportunities:
Identified clear signifiers that grab attention and effectively communicate usage.
Analyzed the hierarchy and placement of search tools to enhance the visibility and usability of the interactive map.
Improved the clarity of in-park jargon and established information architecture patterns for Points of Interest (POIs).
Communicated the necessity of testing various interaction patterns during the design phase.
I used this research not only to assess the current state of the tools but also to outline my vision for enhancing design patterns and improving guest accessibility moving forward.
Low-fidelity Ideation
I spearheaded the initial ideation phase once the team reached a consensus on project objectives.
I used Mind Mapping and Rapid Ideation techniques to generate a diverse array of ideas, followed by a SWOT analysis to streamline options.
I identified two primary patterns for the interactive map's structure and developed low-fi models from there:
• After further refinement, I presented three design concepts (1a, 1b, and 2) to the team.
• The goal for primary research: test two distinct approaches to building the interactive map.


Primary Research
I coded data for each wireframe prototype, noting the pros and cons as the product team approved the concepts for testing.
Collaborating with my design partner, Rebecca Bar, and our partners at Dojo, we presented our data.
The research was conducted online with a group of anonymous volunteers.
Design Principles
User Control and Freedom.
Recognition rather than recall.
Visibility of System Status.


H1
H6
H3
Mid-fidelity Ideation
Armed with clear data indicating the most promising prototype, I presented our findings.
Referencing insights from the heuristic evaluation, I demonstrated how each prototype identified issues.
Correlating this with the research data further strengthened the case for selecting the optimal prototype to iterate upon.
The product team gained a fundamental understanding of the direction based on user insights. I welcomed their input on incorporating elements from other prototypes if desired.
High-fidelity Ideation
Following a month of meetings to discuss updates and progress, I emphasized to the product team the importance of involving developers as we moved forward.
Once the engineers were included in the conversation, design ideas naturally scaled down without friction. We focused on improving the interactive map based on three core design principles: 'Interaction First', 'Clear Signifiers', and 'Immediate Response'.
Interaction First
Clear Signifiers

Immediate Response

Global Integration: Hollywood and Japan
With the interactive map established and major design elements fleshed out and approved, it was time to synchronize with teams around the world.
I had the opportunity to present my work to the Universal Hollywood team and Japan for the first time. We discussed our journey, including the heuristic evaluation and research results that guided our decisions.
Collaboration with Chaos and Dojo:
The final synchronization required internal alignment between the agency I worked for and the agency housing the other designers. During the critical phases of high-fidelity iteration, a brief silo occurred due to time constraints, which was not the fault of any one party.
However, through quick thinking and the talent of the design team at Dojo, we identified research and design solutions that could be integrated seamlessly between our teams. By combining the interactive maps and the filtered list component within the Universal ecosystem, the product transitioned successfully into its documentation phase.
Currently, the Interactive Map is in its launch phase, progressing through engineering pipelines for deployment across Universal regions worldwide. This marks a significant milestone in enhancing guest experiences across Universal Parks and Resorts.
I would like to extend my heartfelt thanks to the following individuals and teams for their exceptional guidance and support during this project:
->Paola Reyes
->Matt Wittkamp
->The team at Universal
->The team at Dojo
->Rebecca Bar
I am truly grateful to God for bringing me close to each one of you and for His blessings throughout this journey. Thank you for your valuable contributions and collaboration.